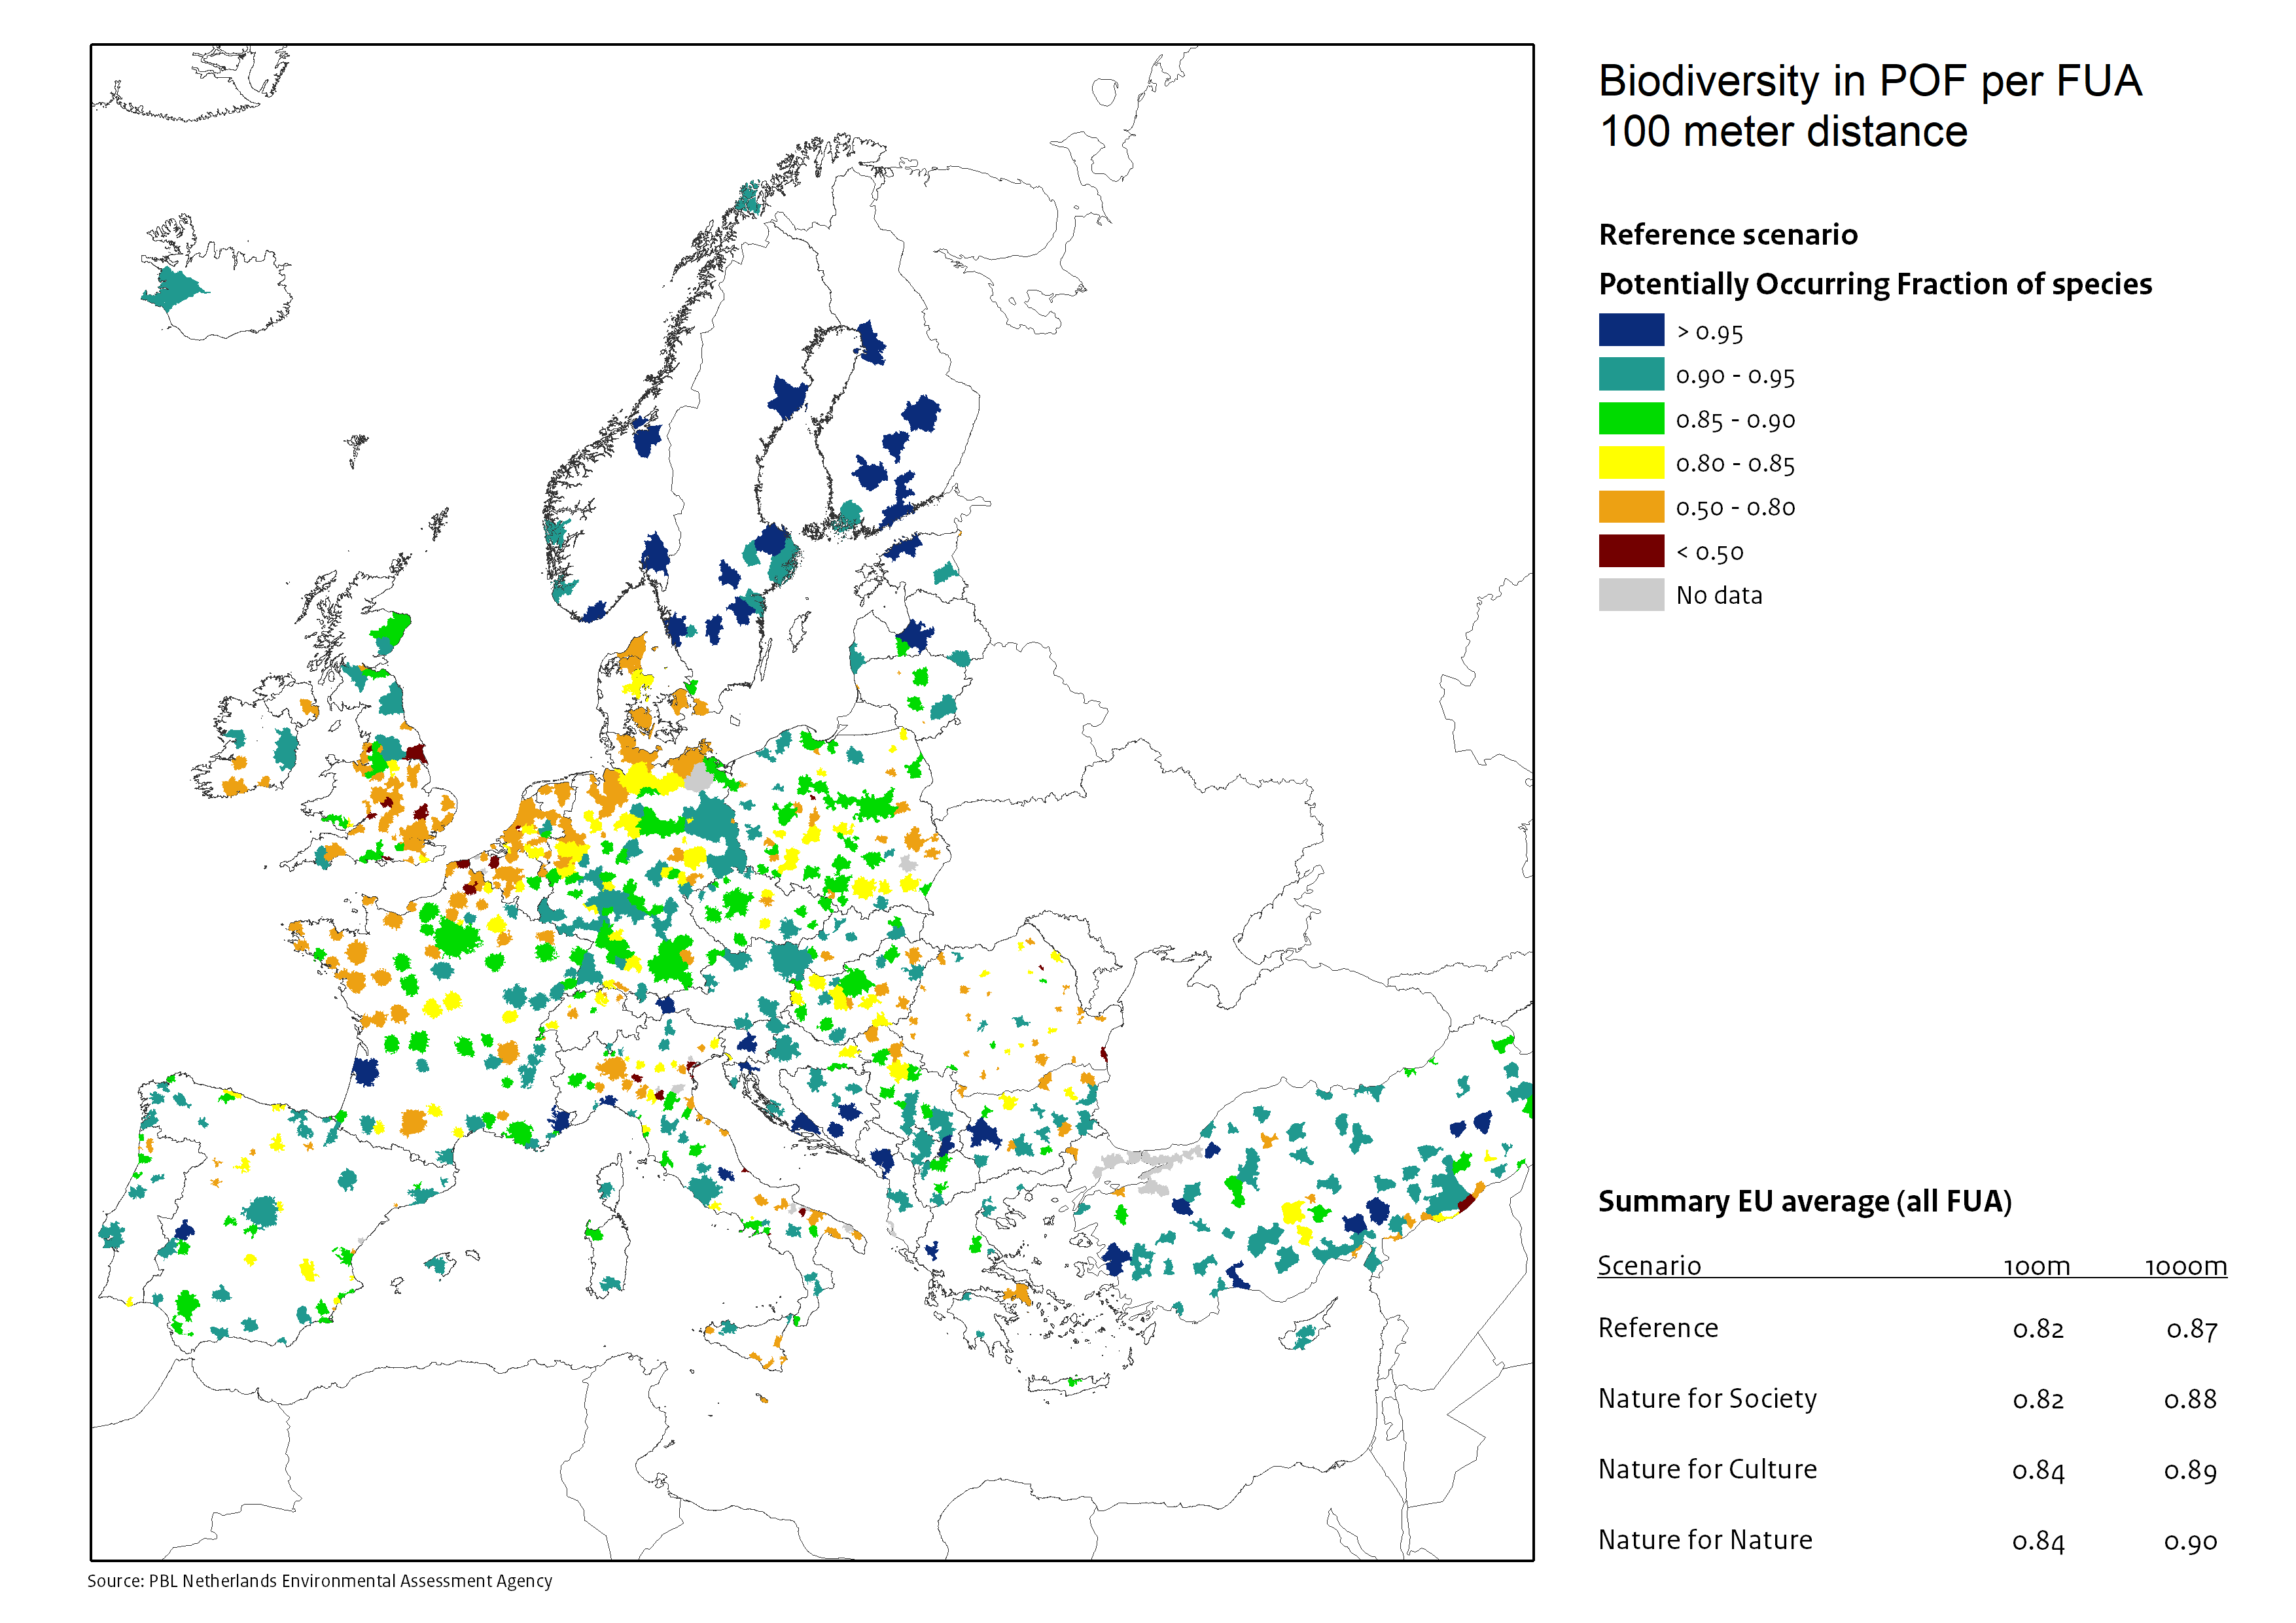
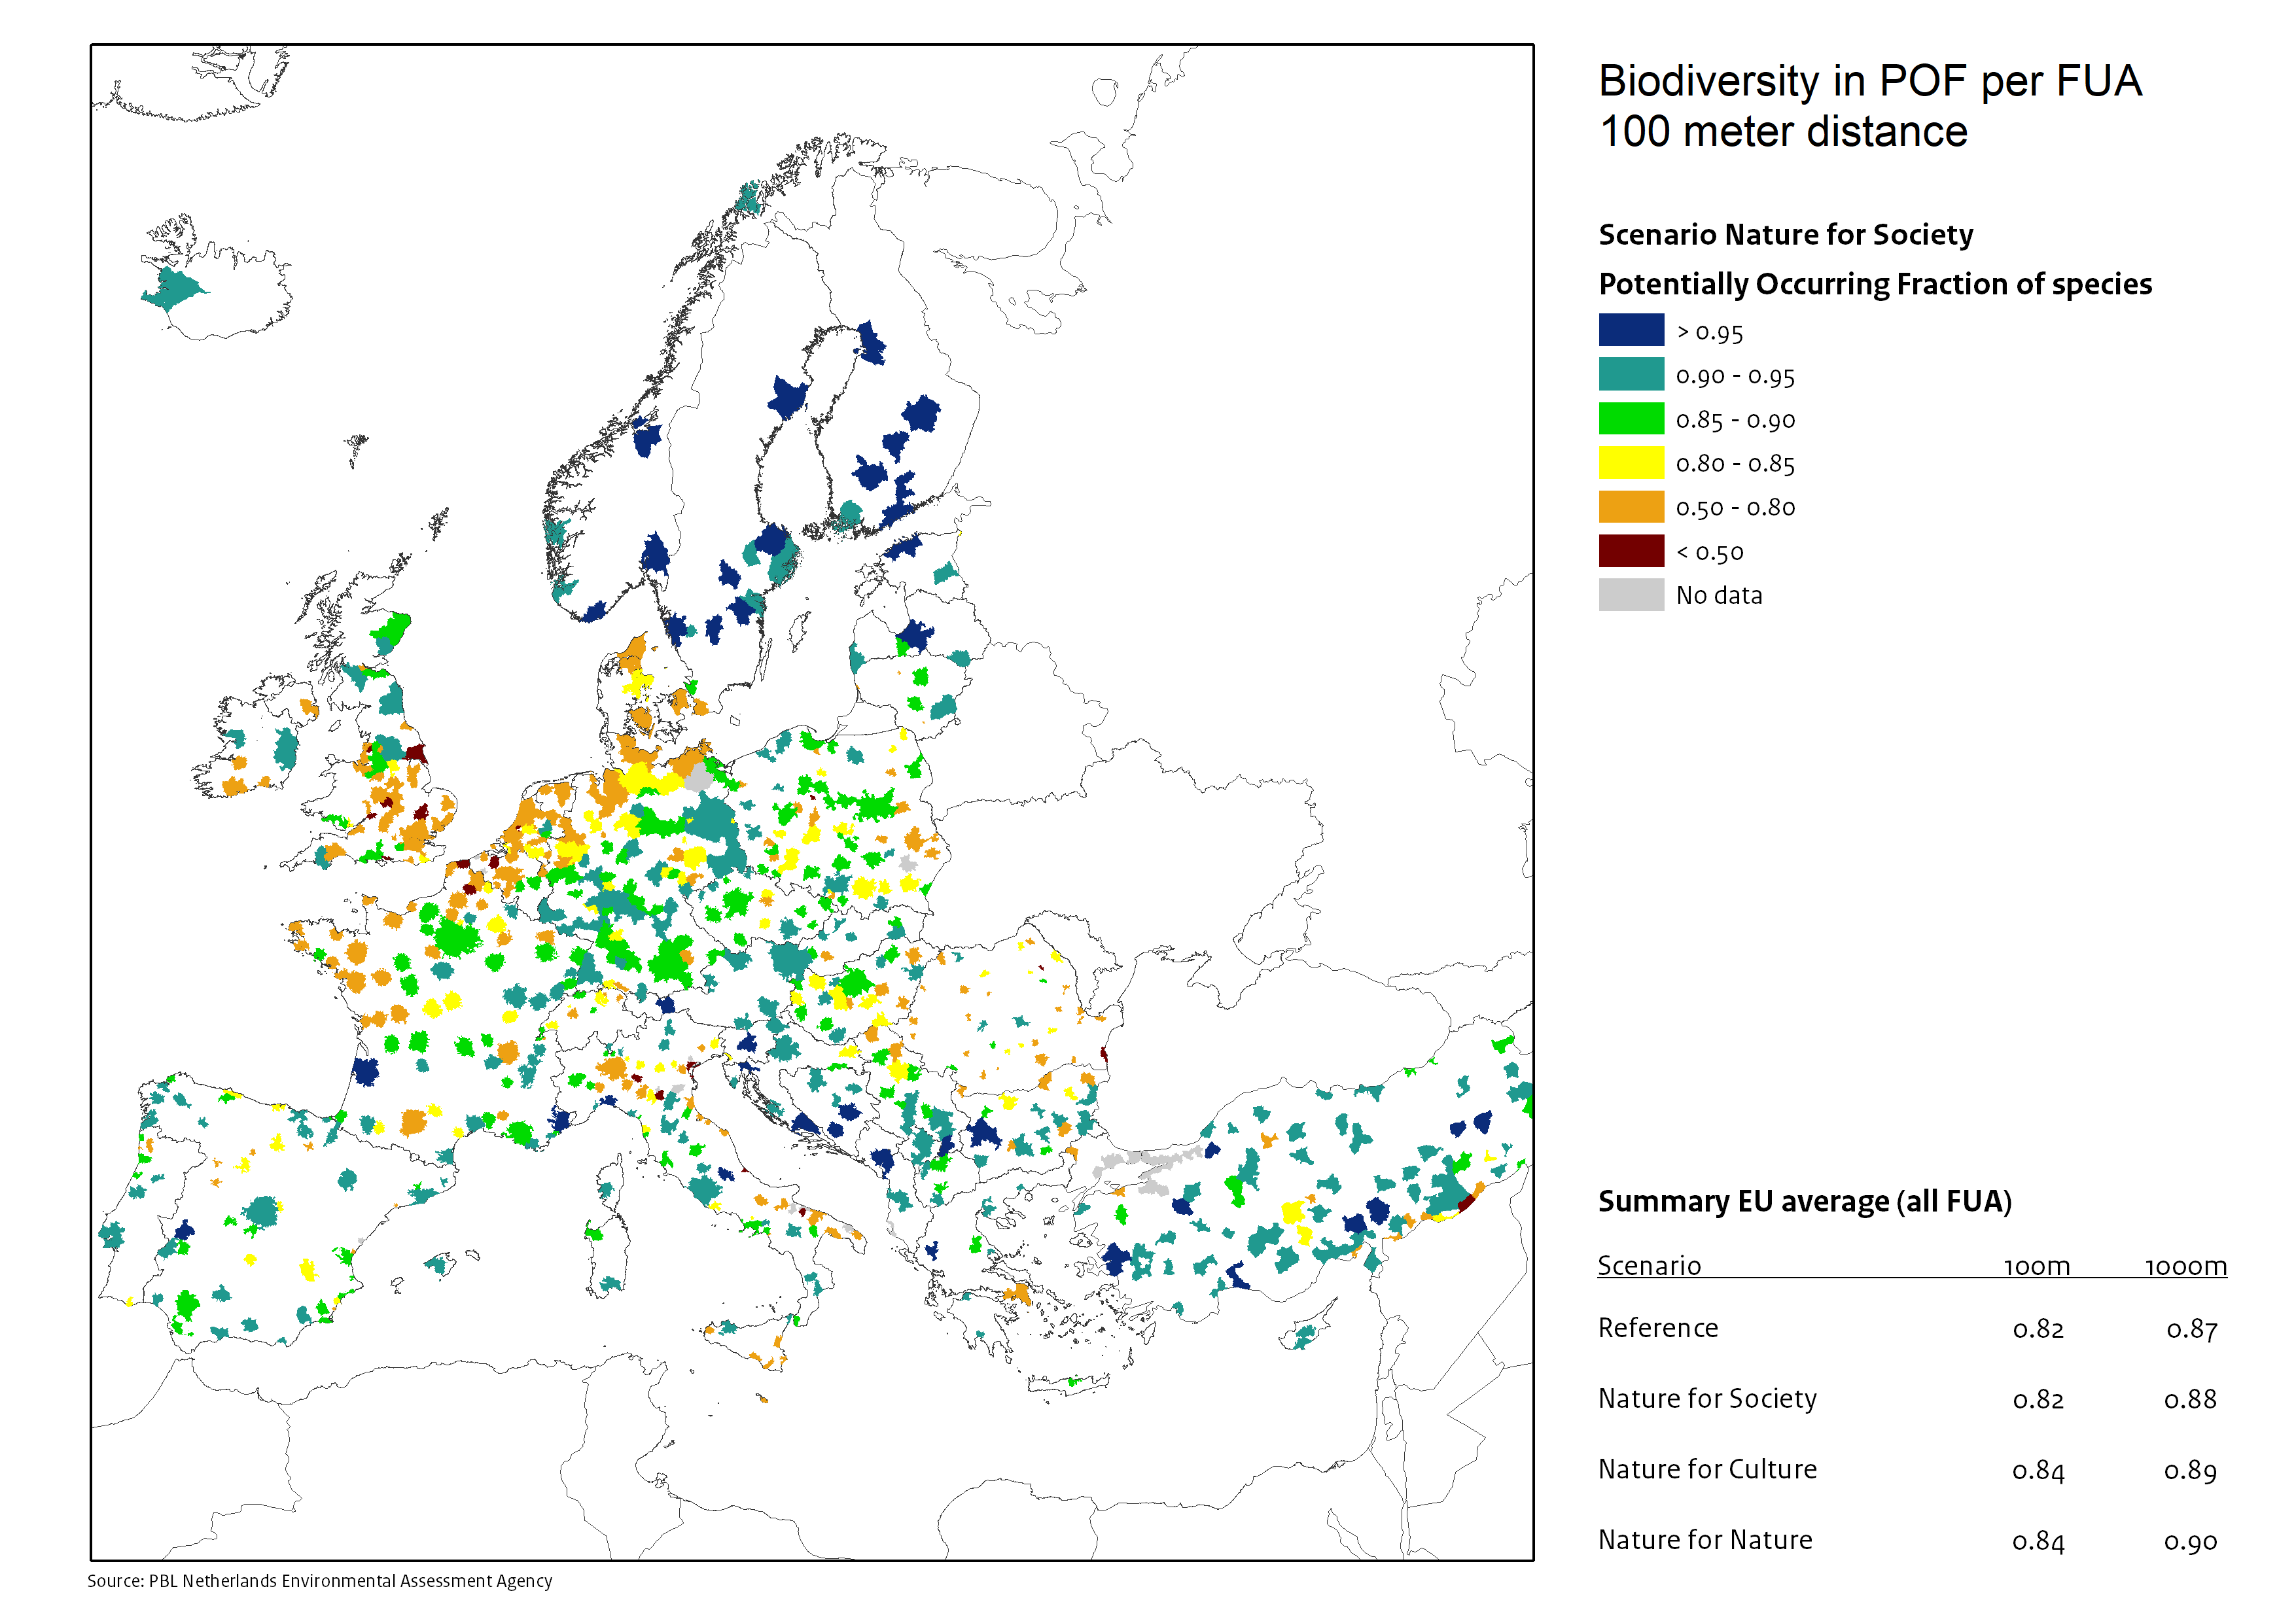
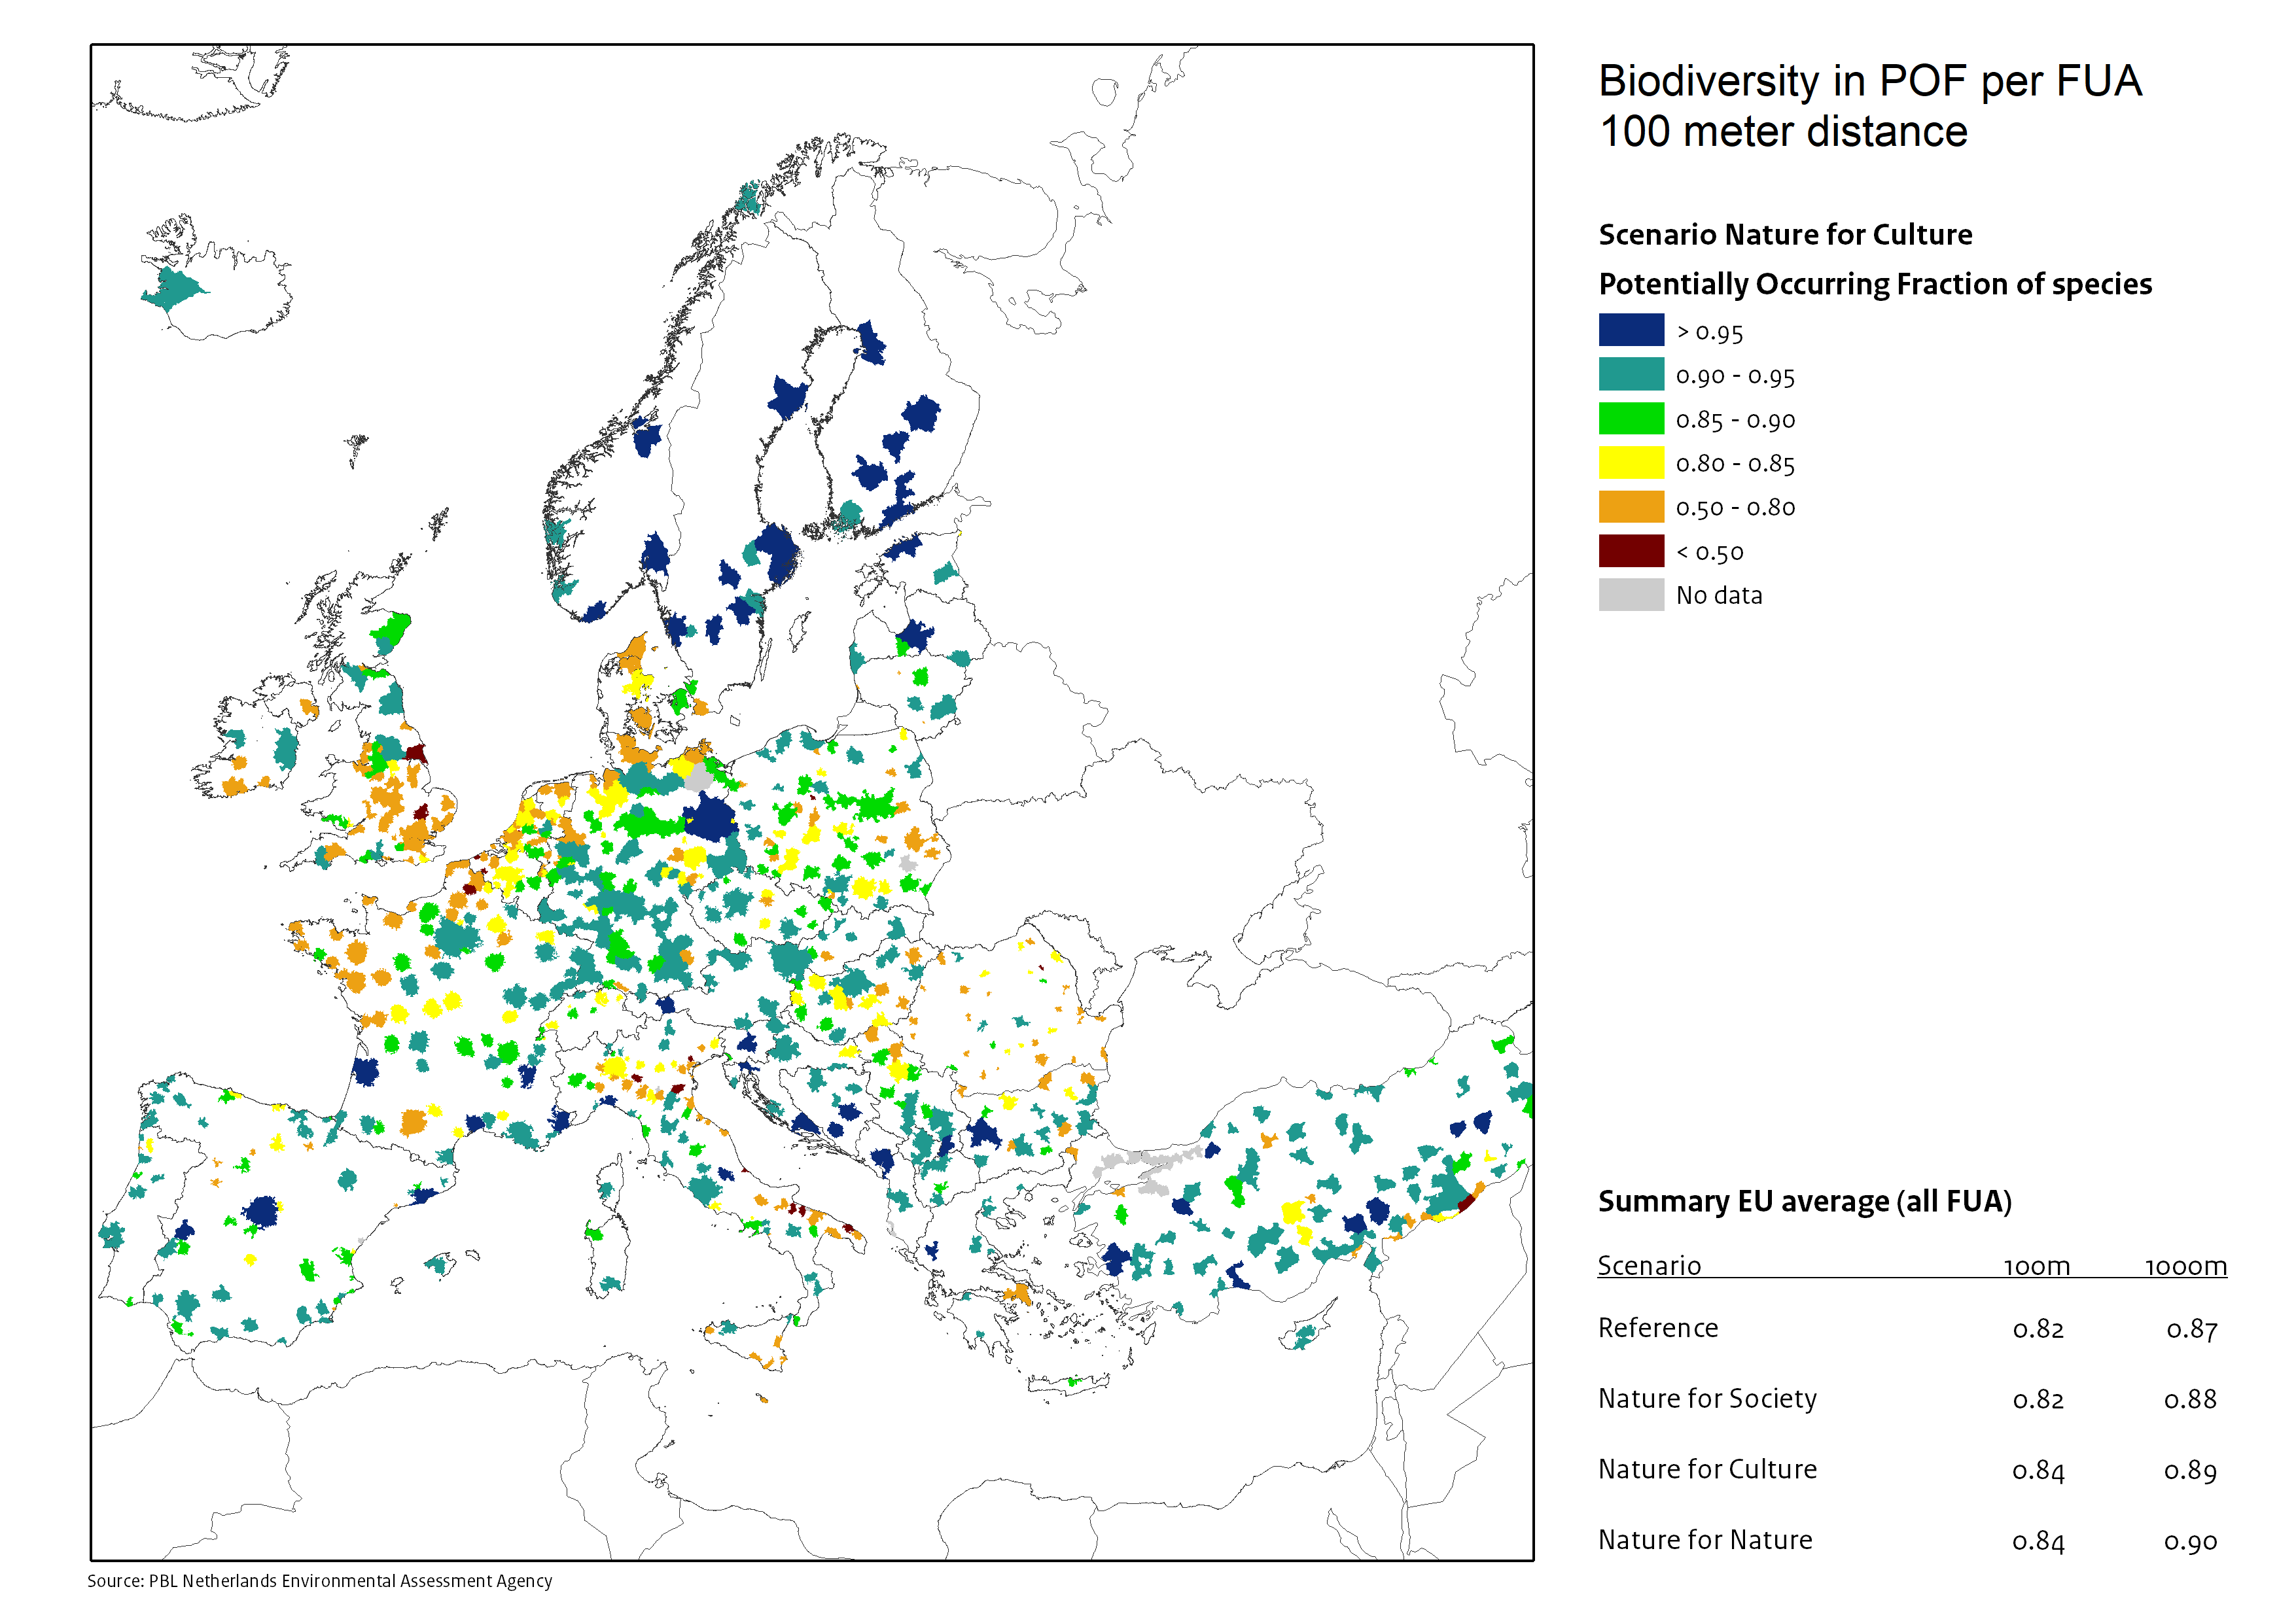
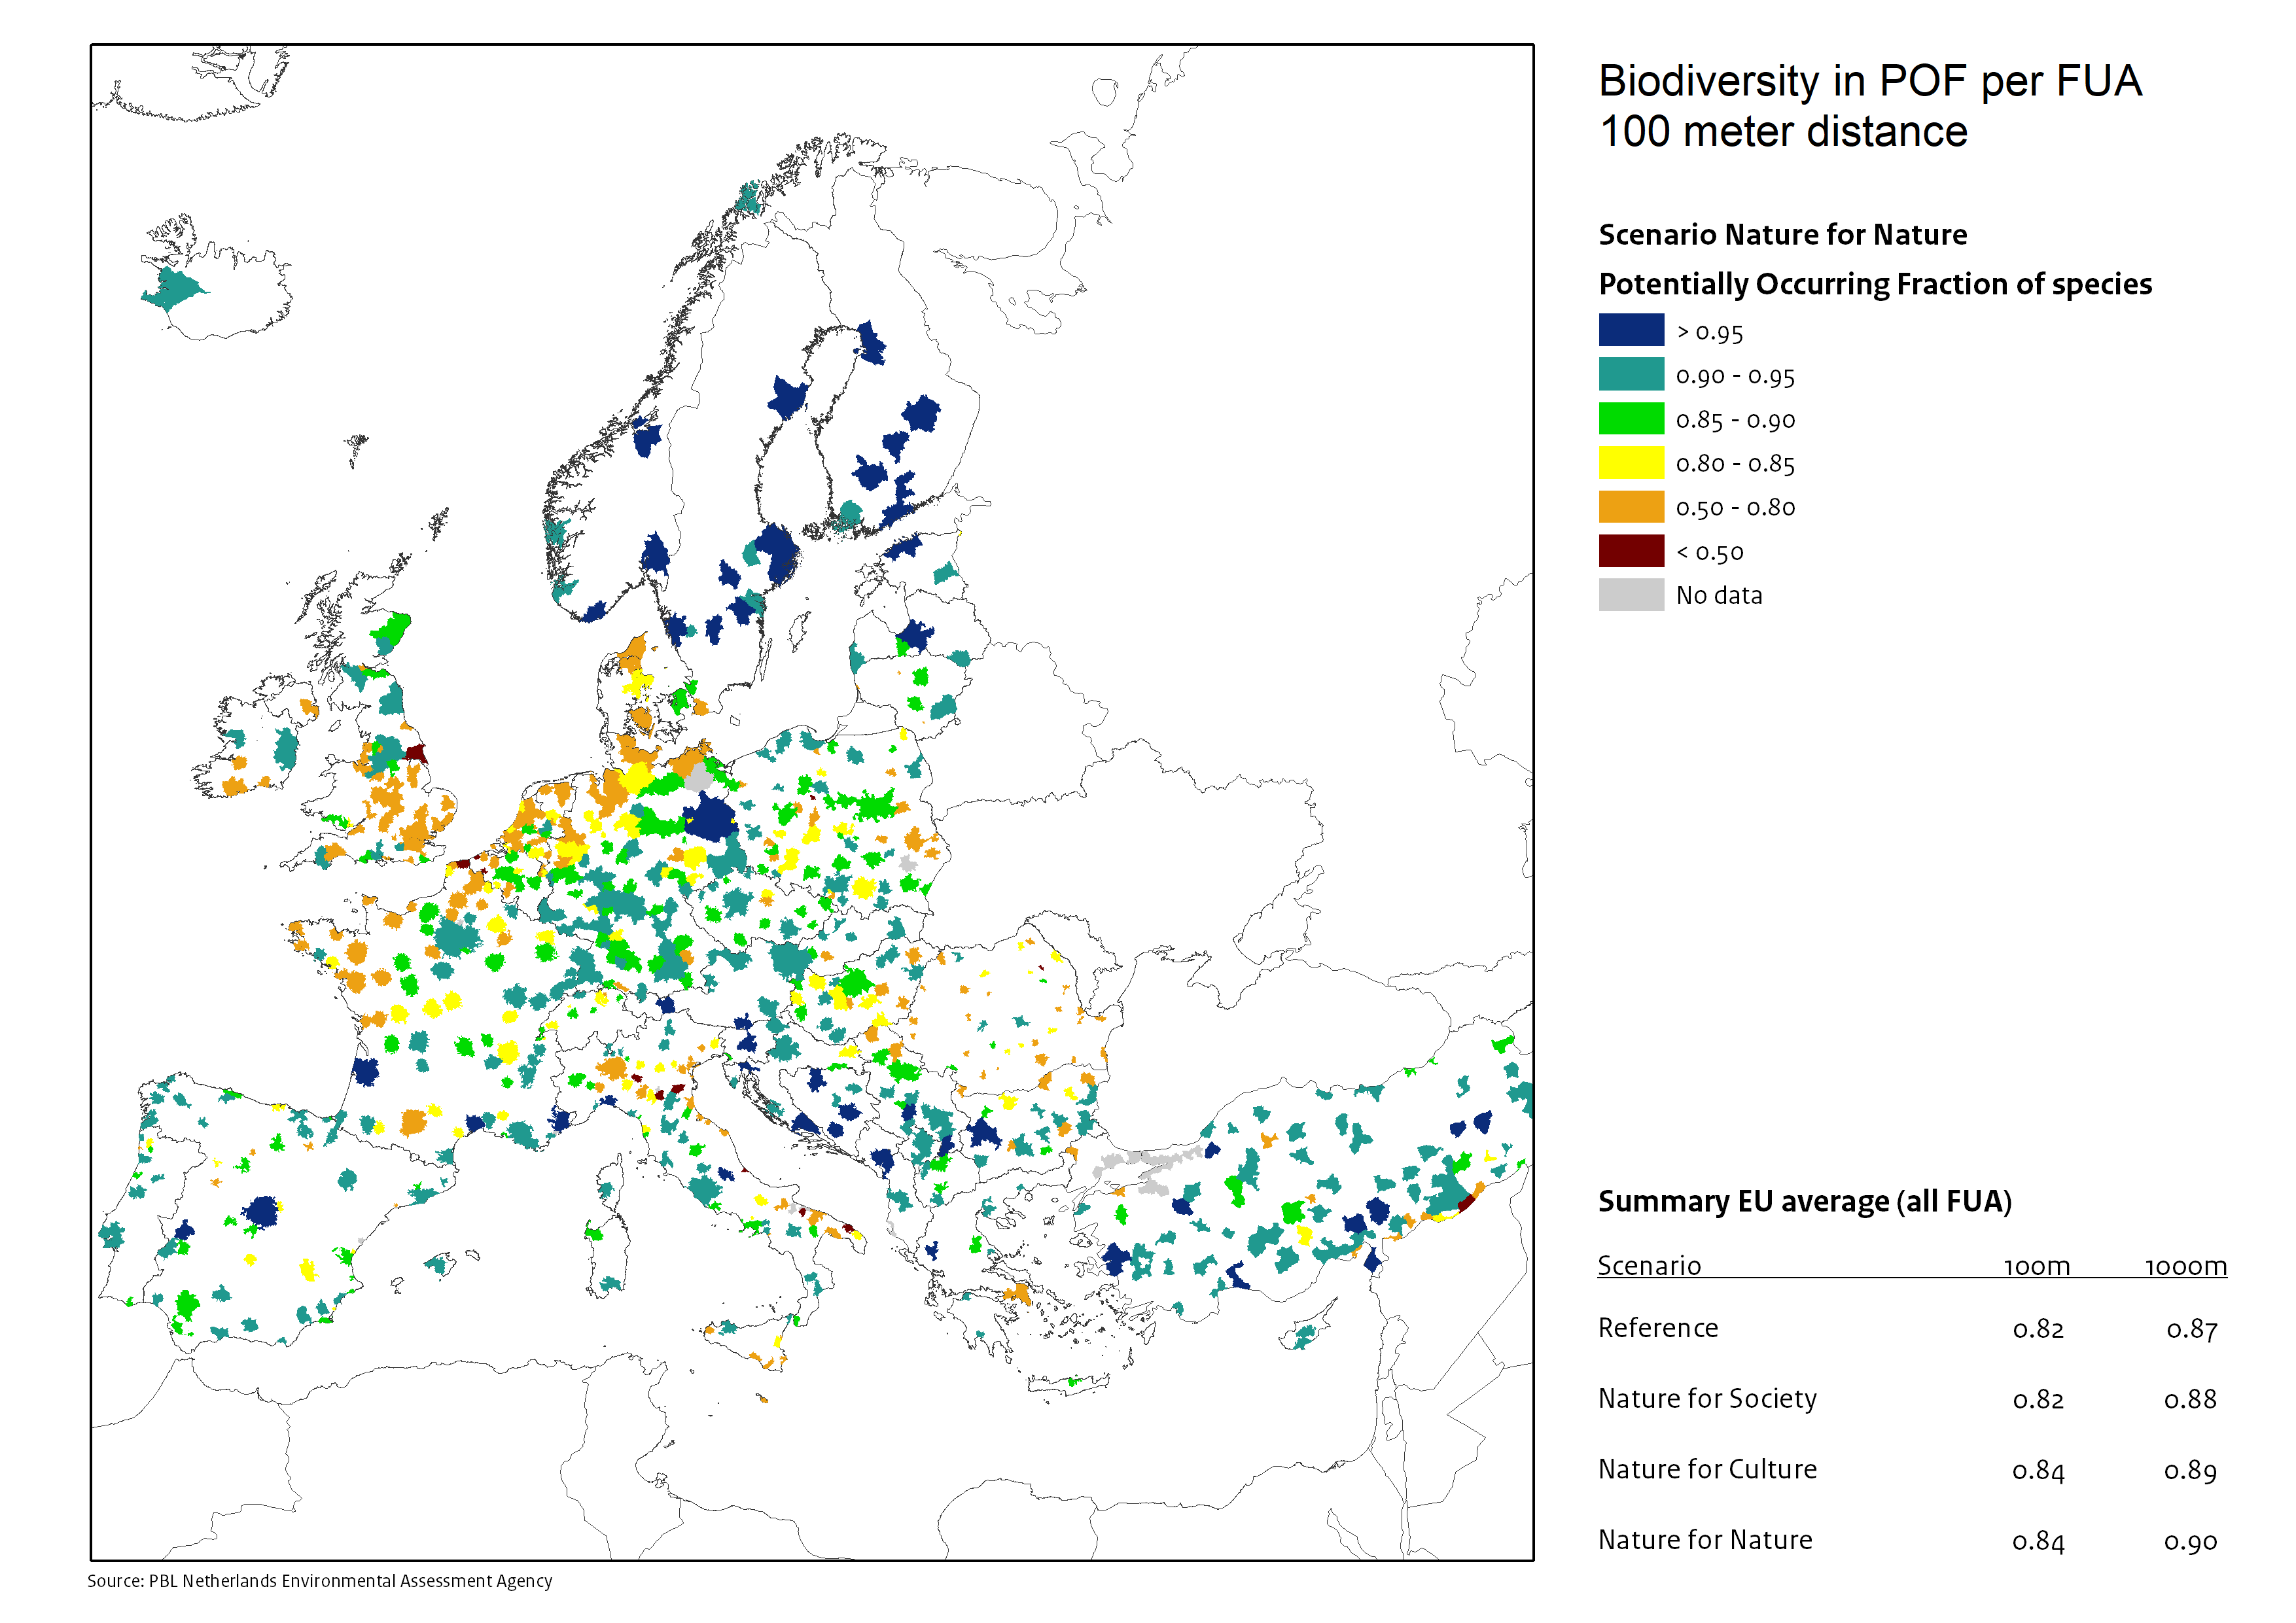
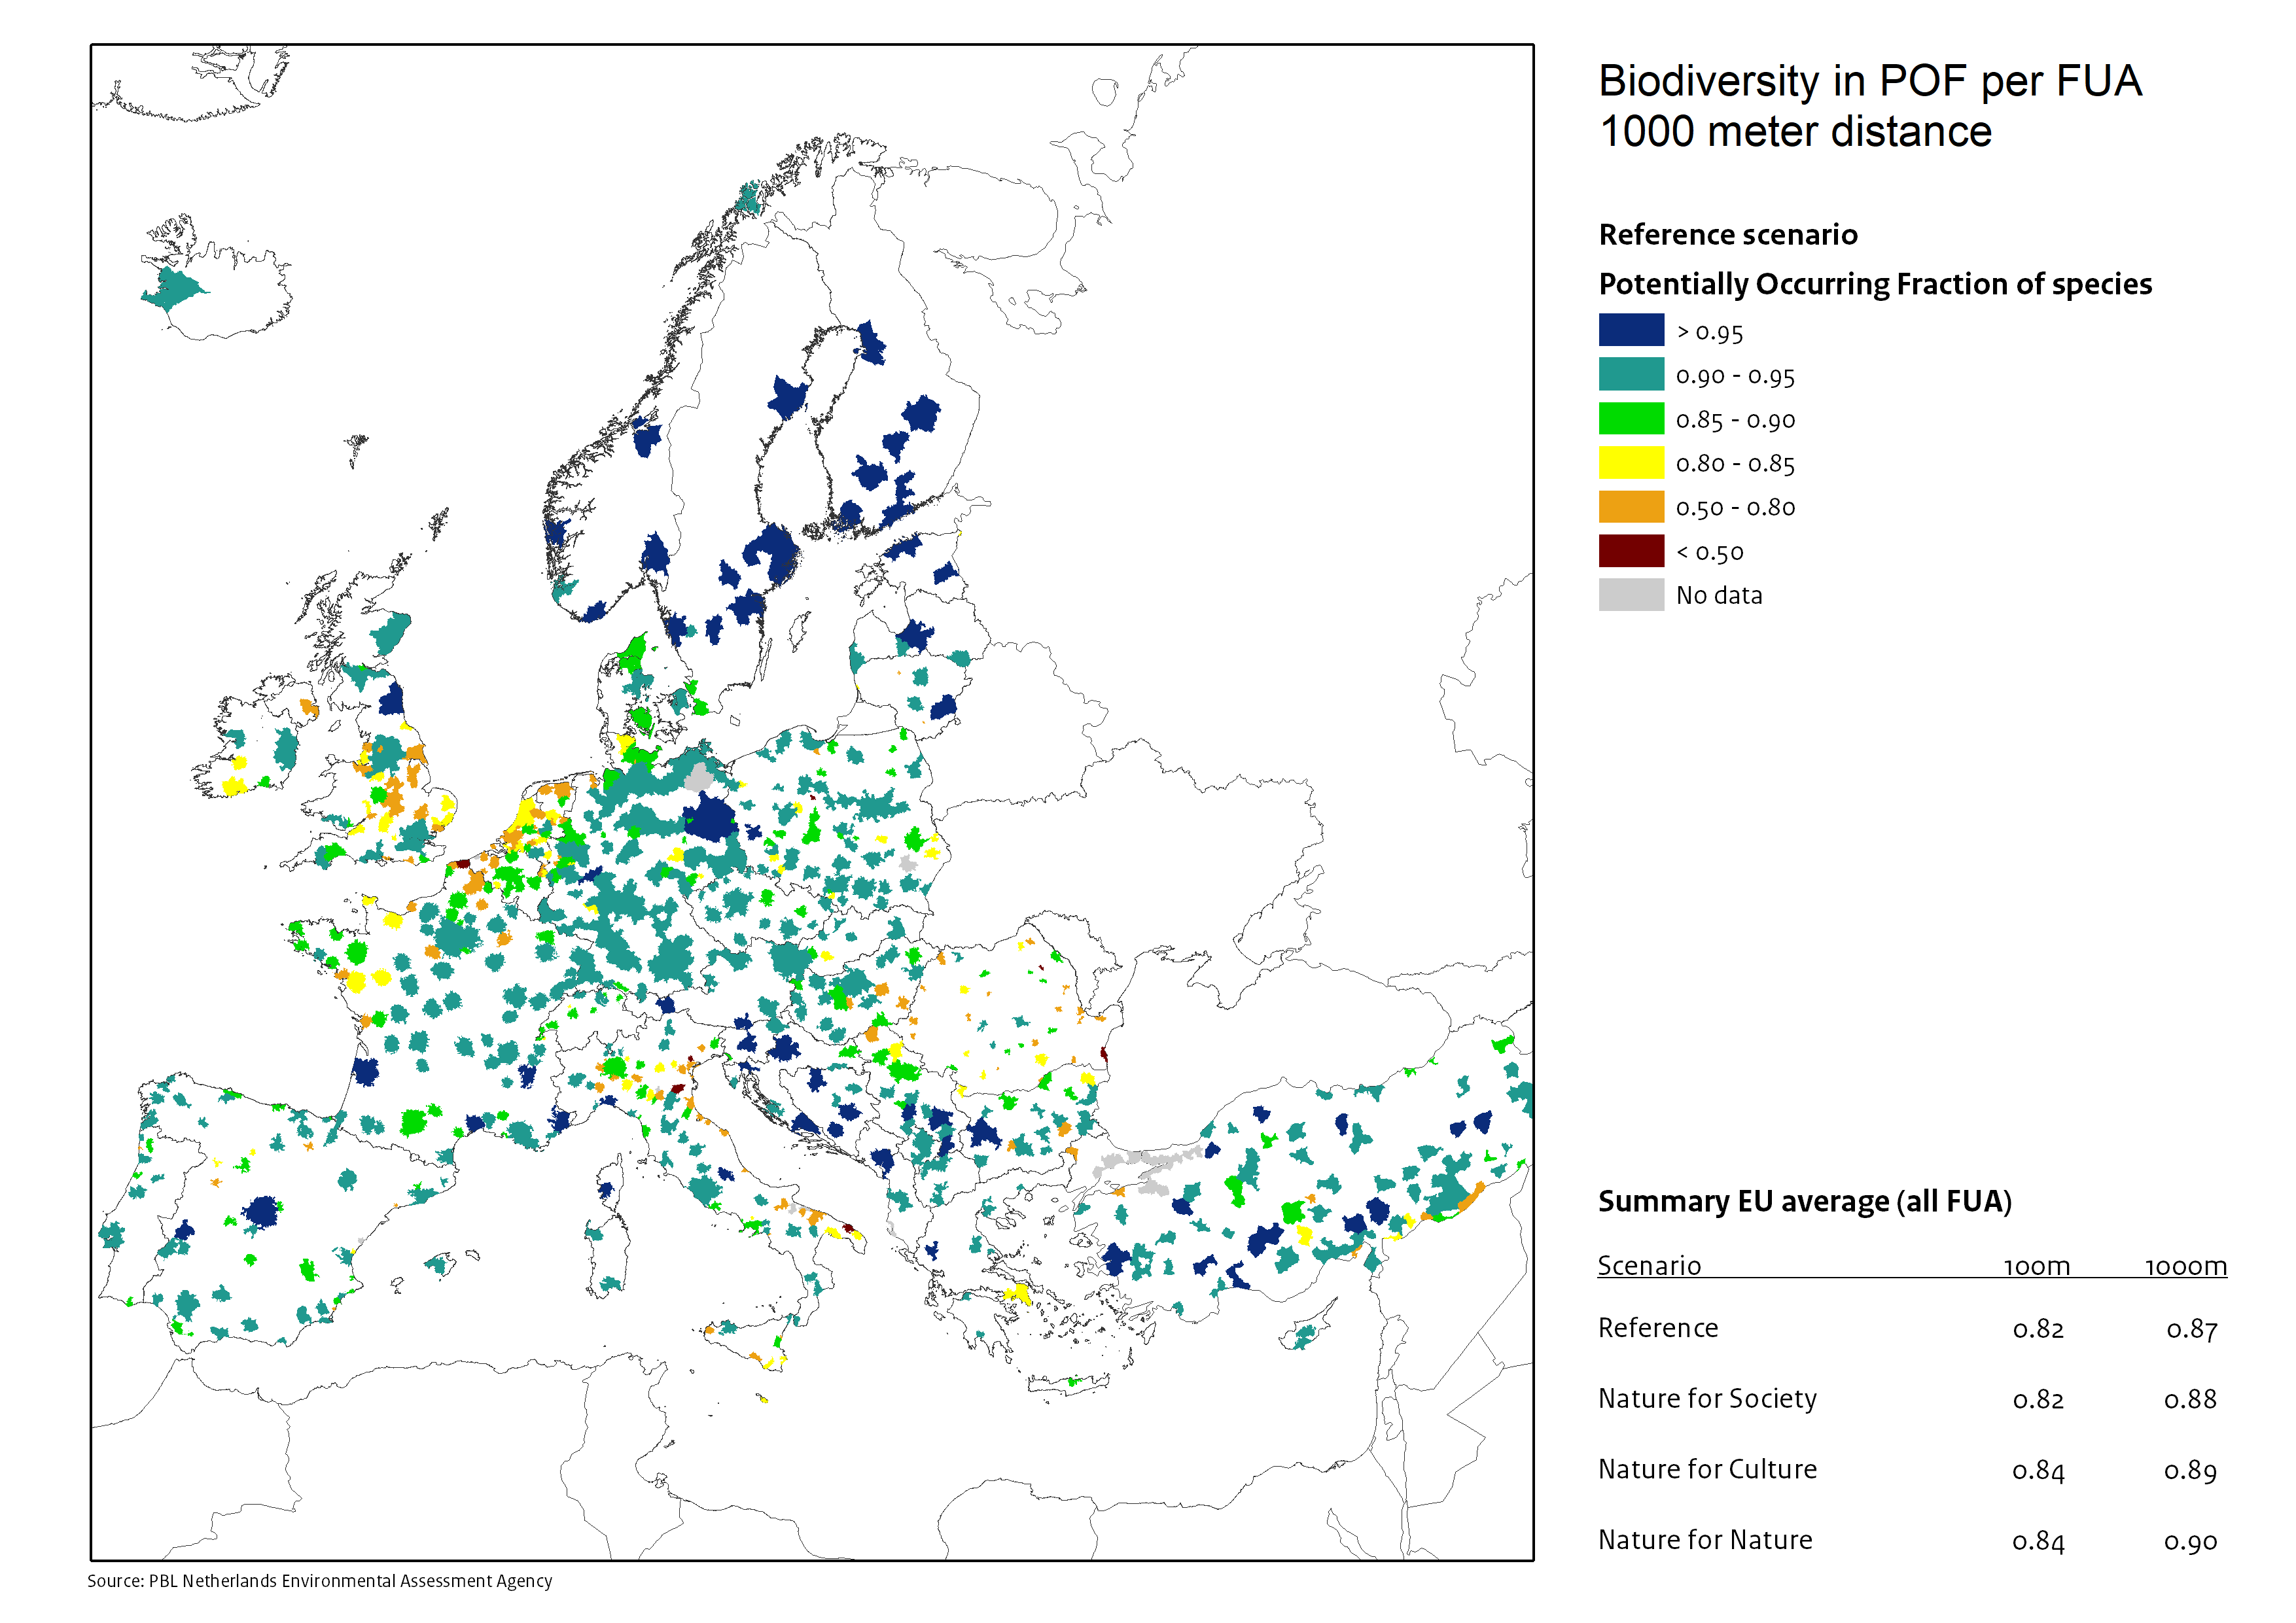
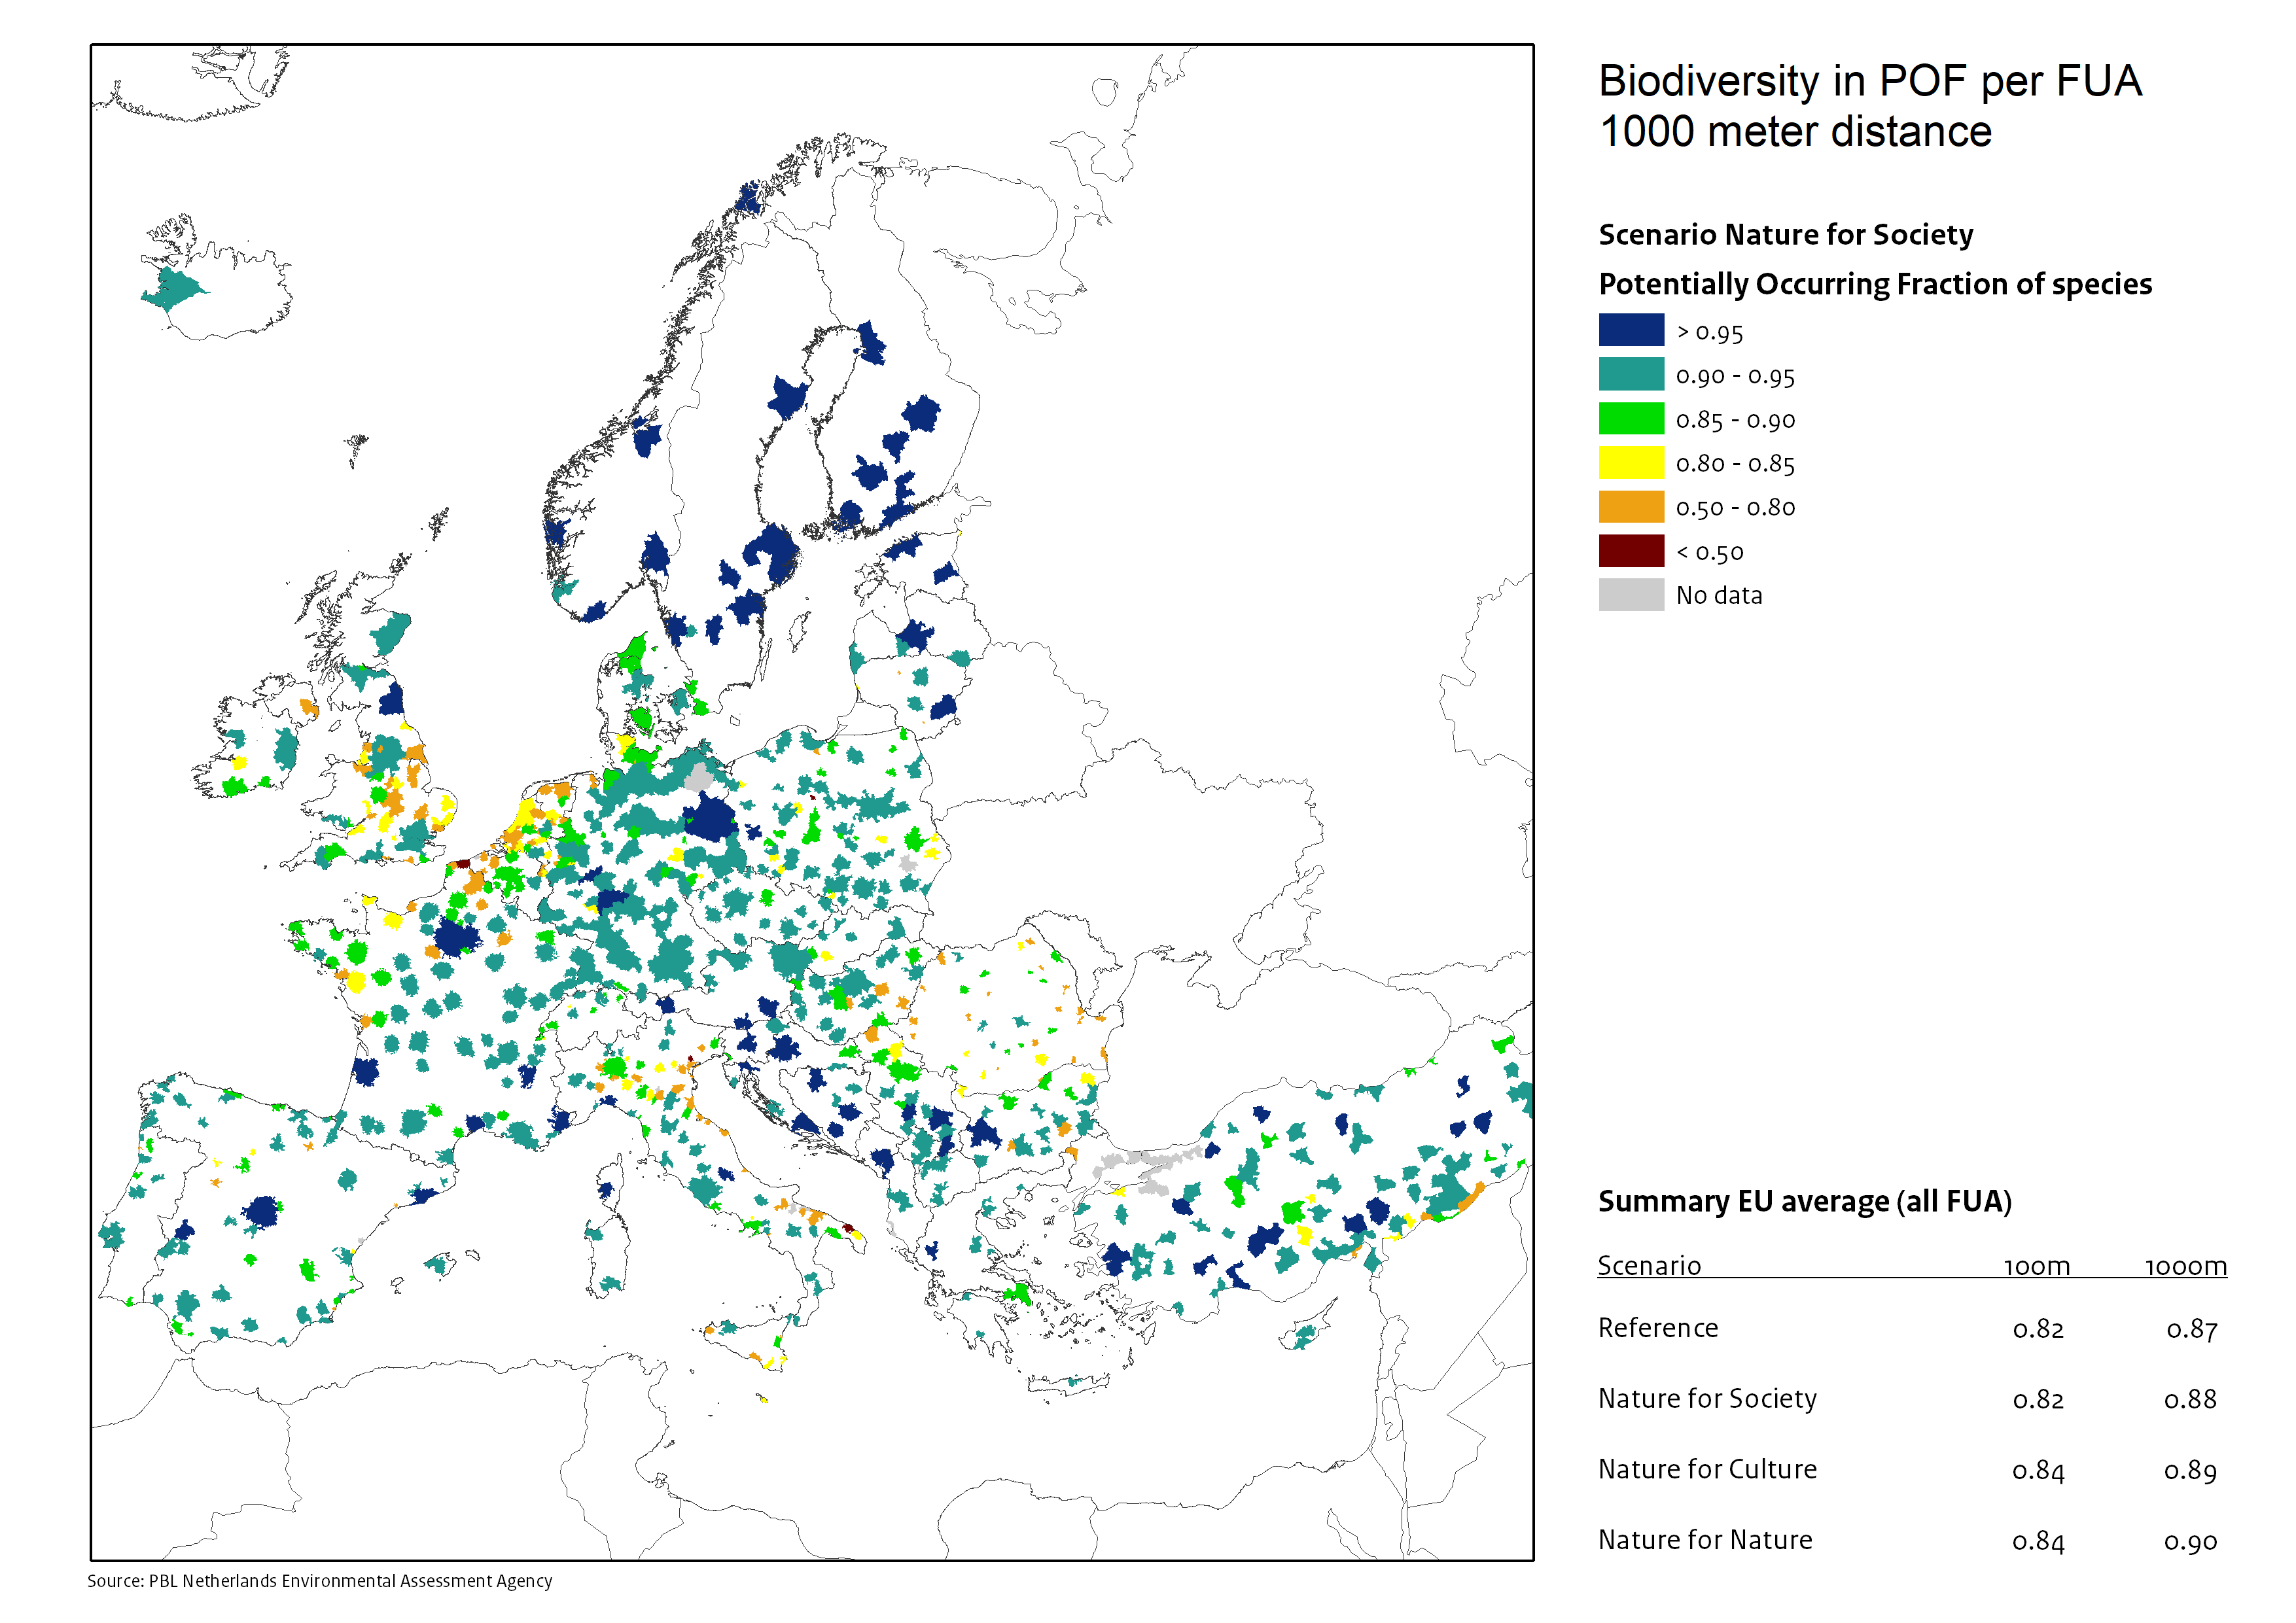
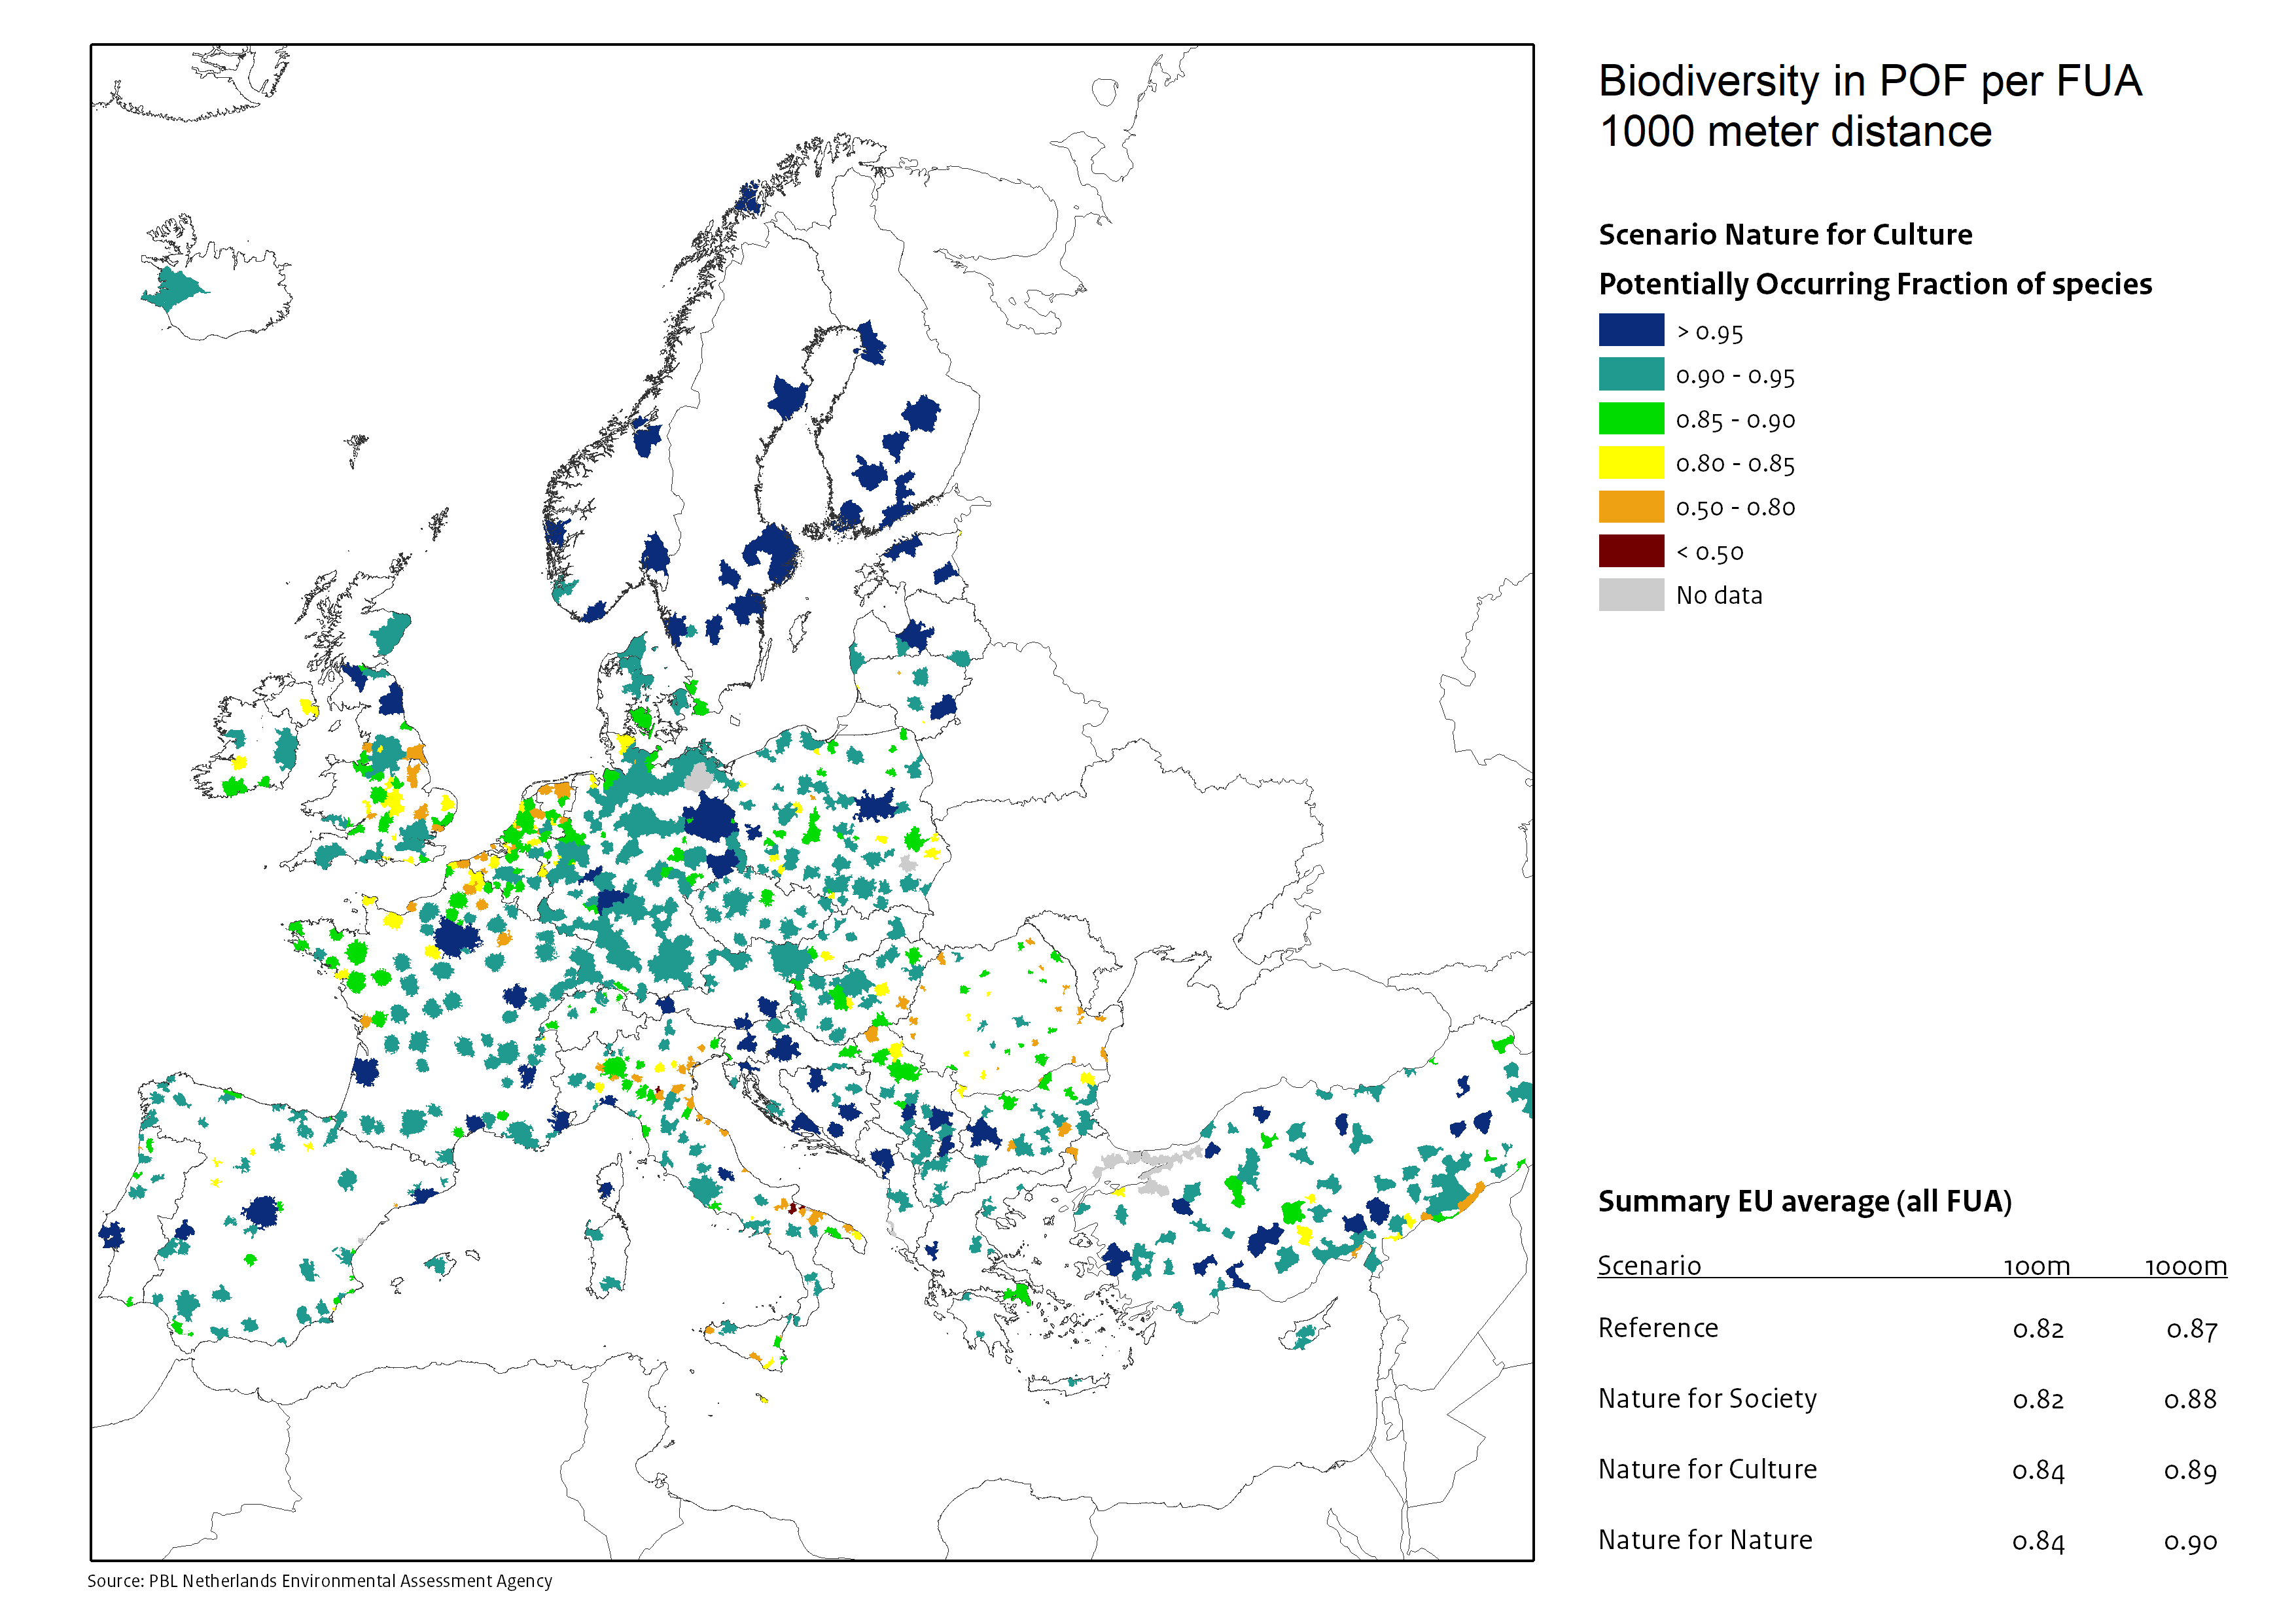
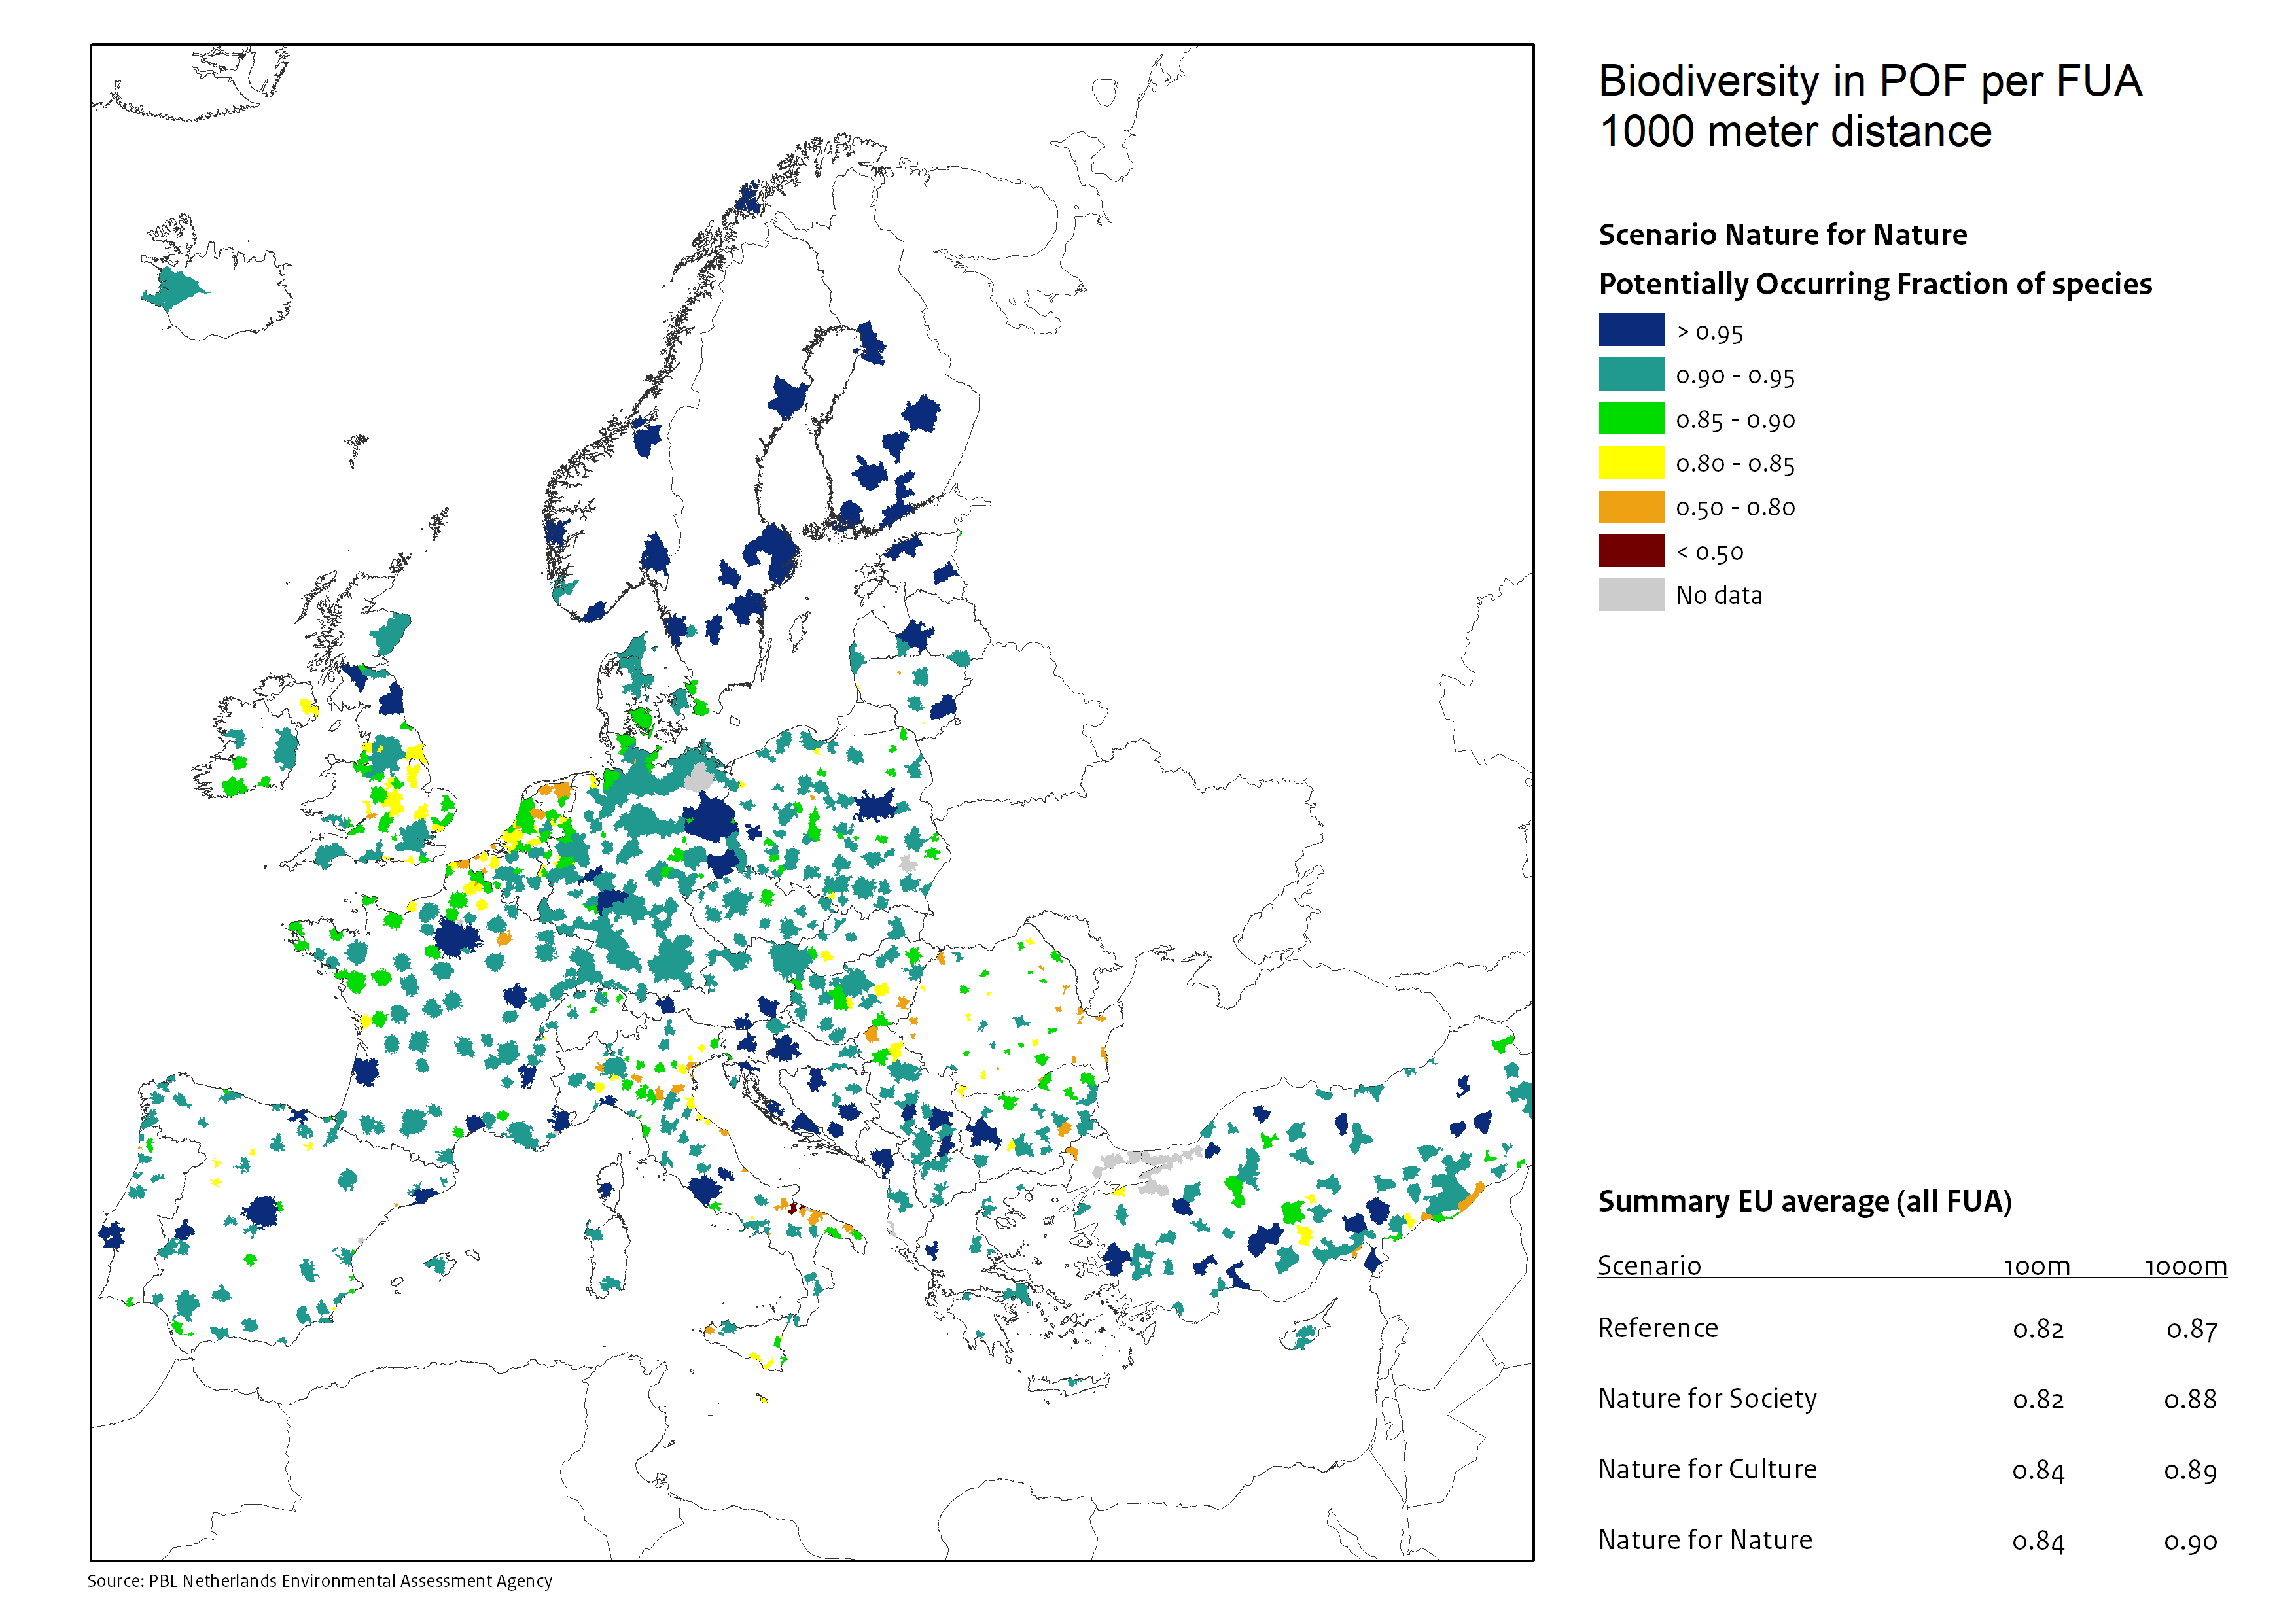
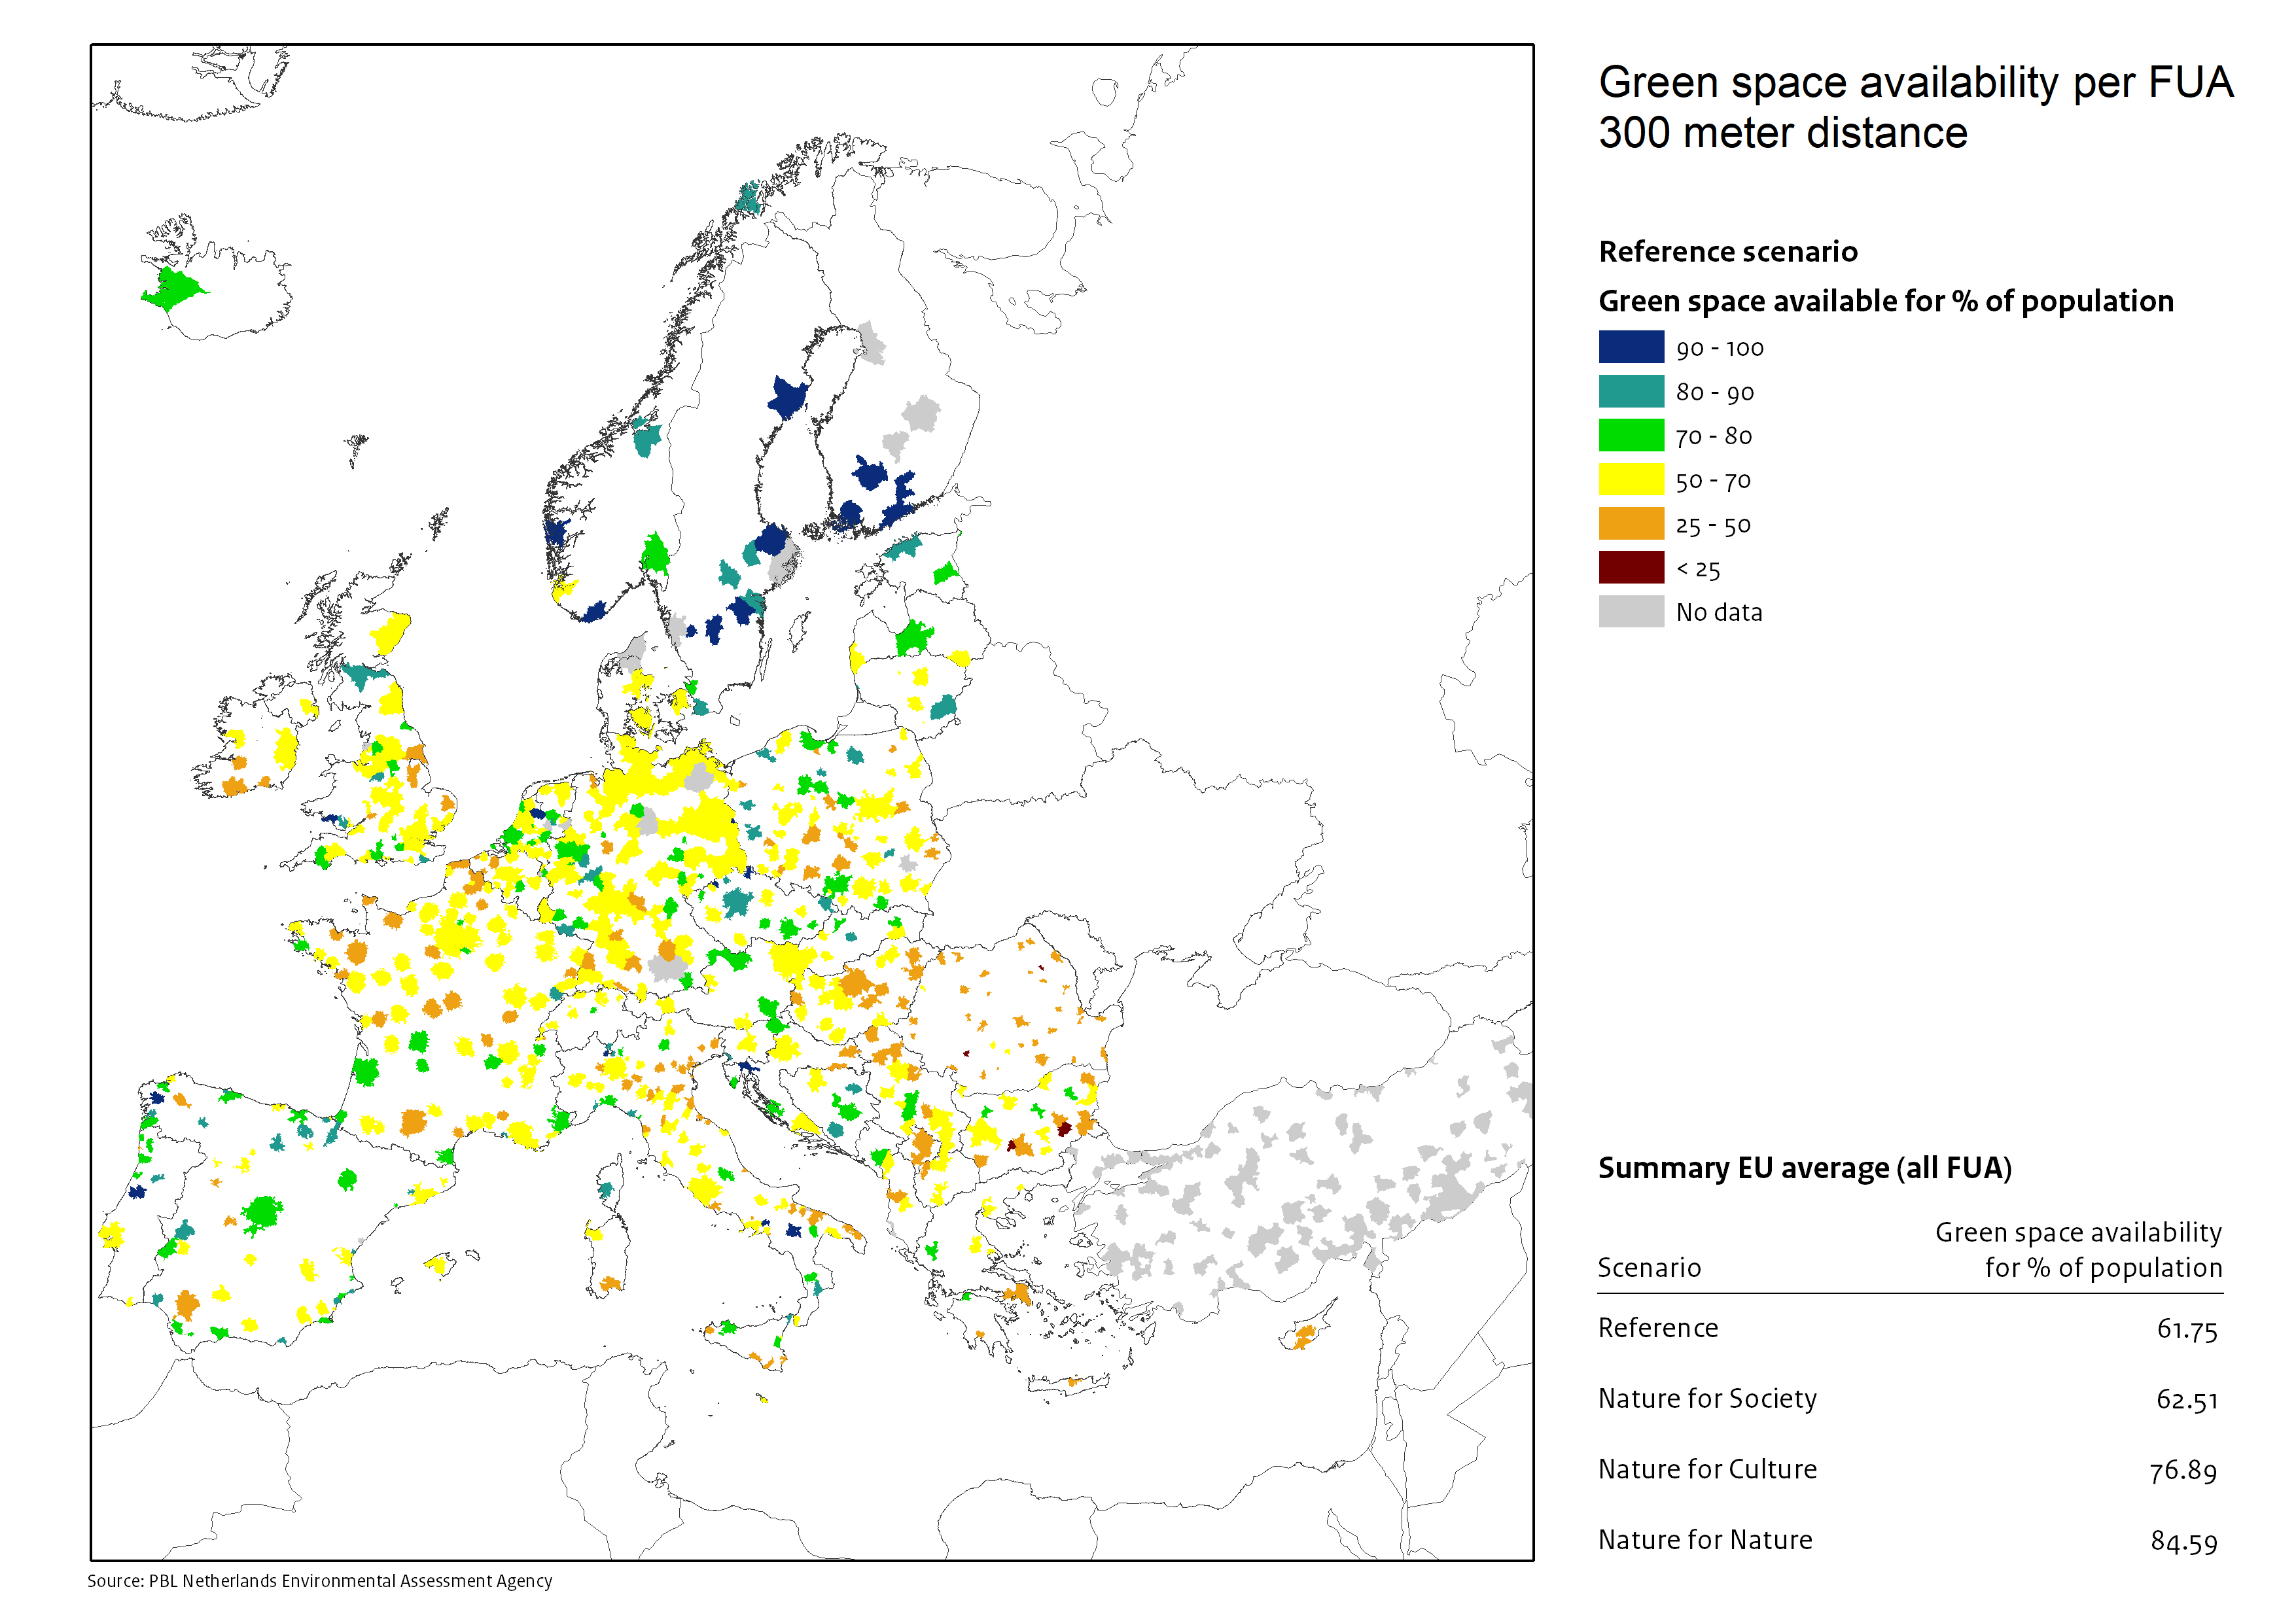
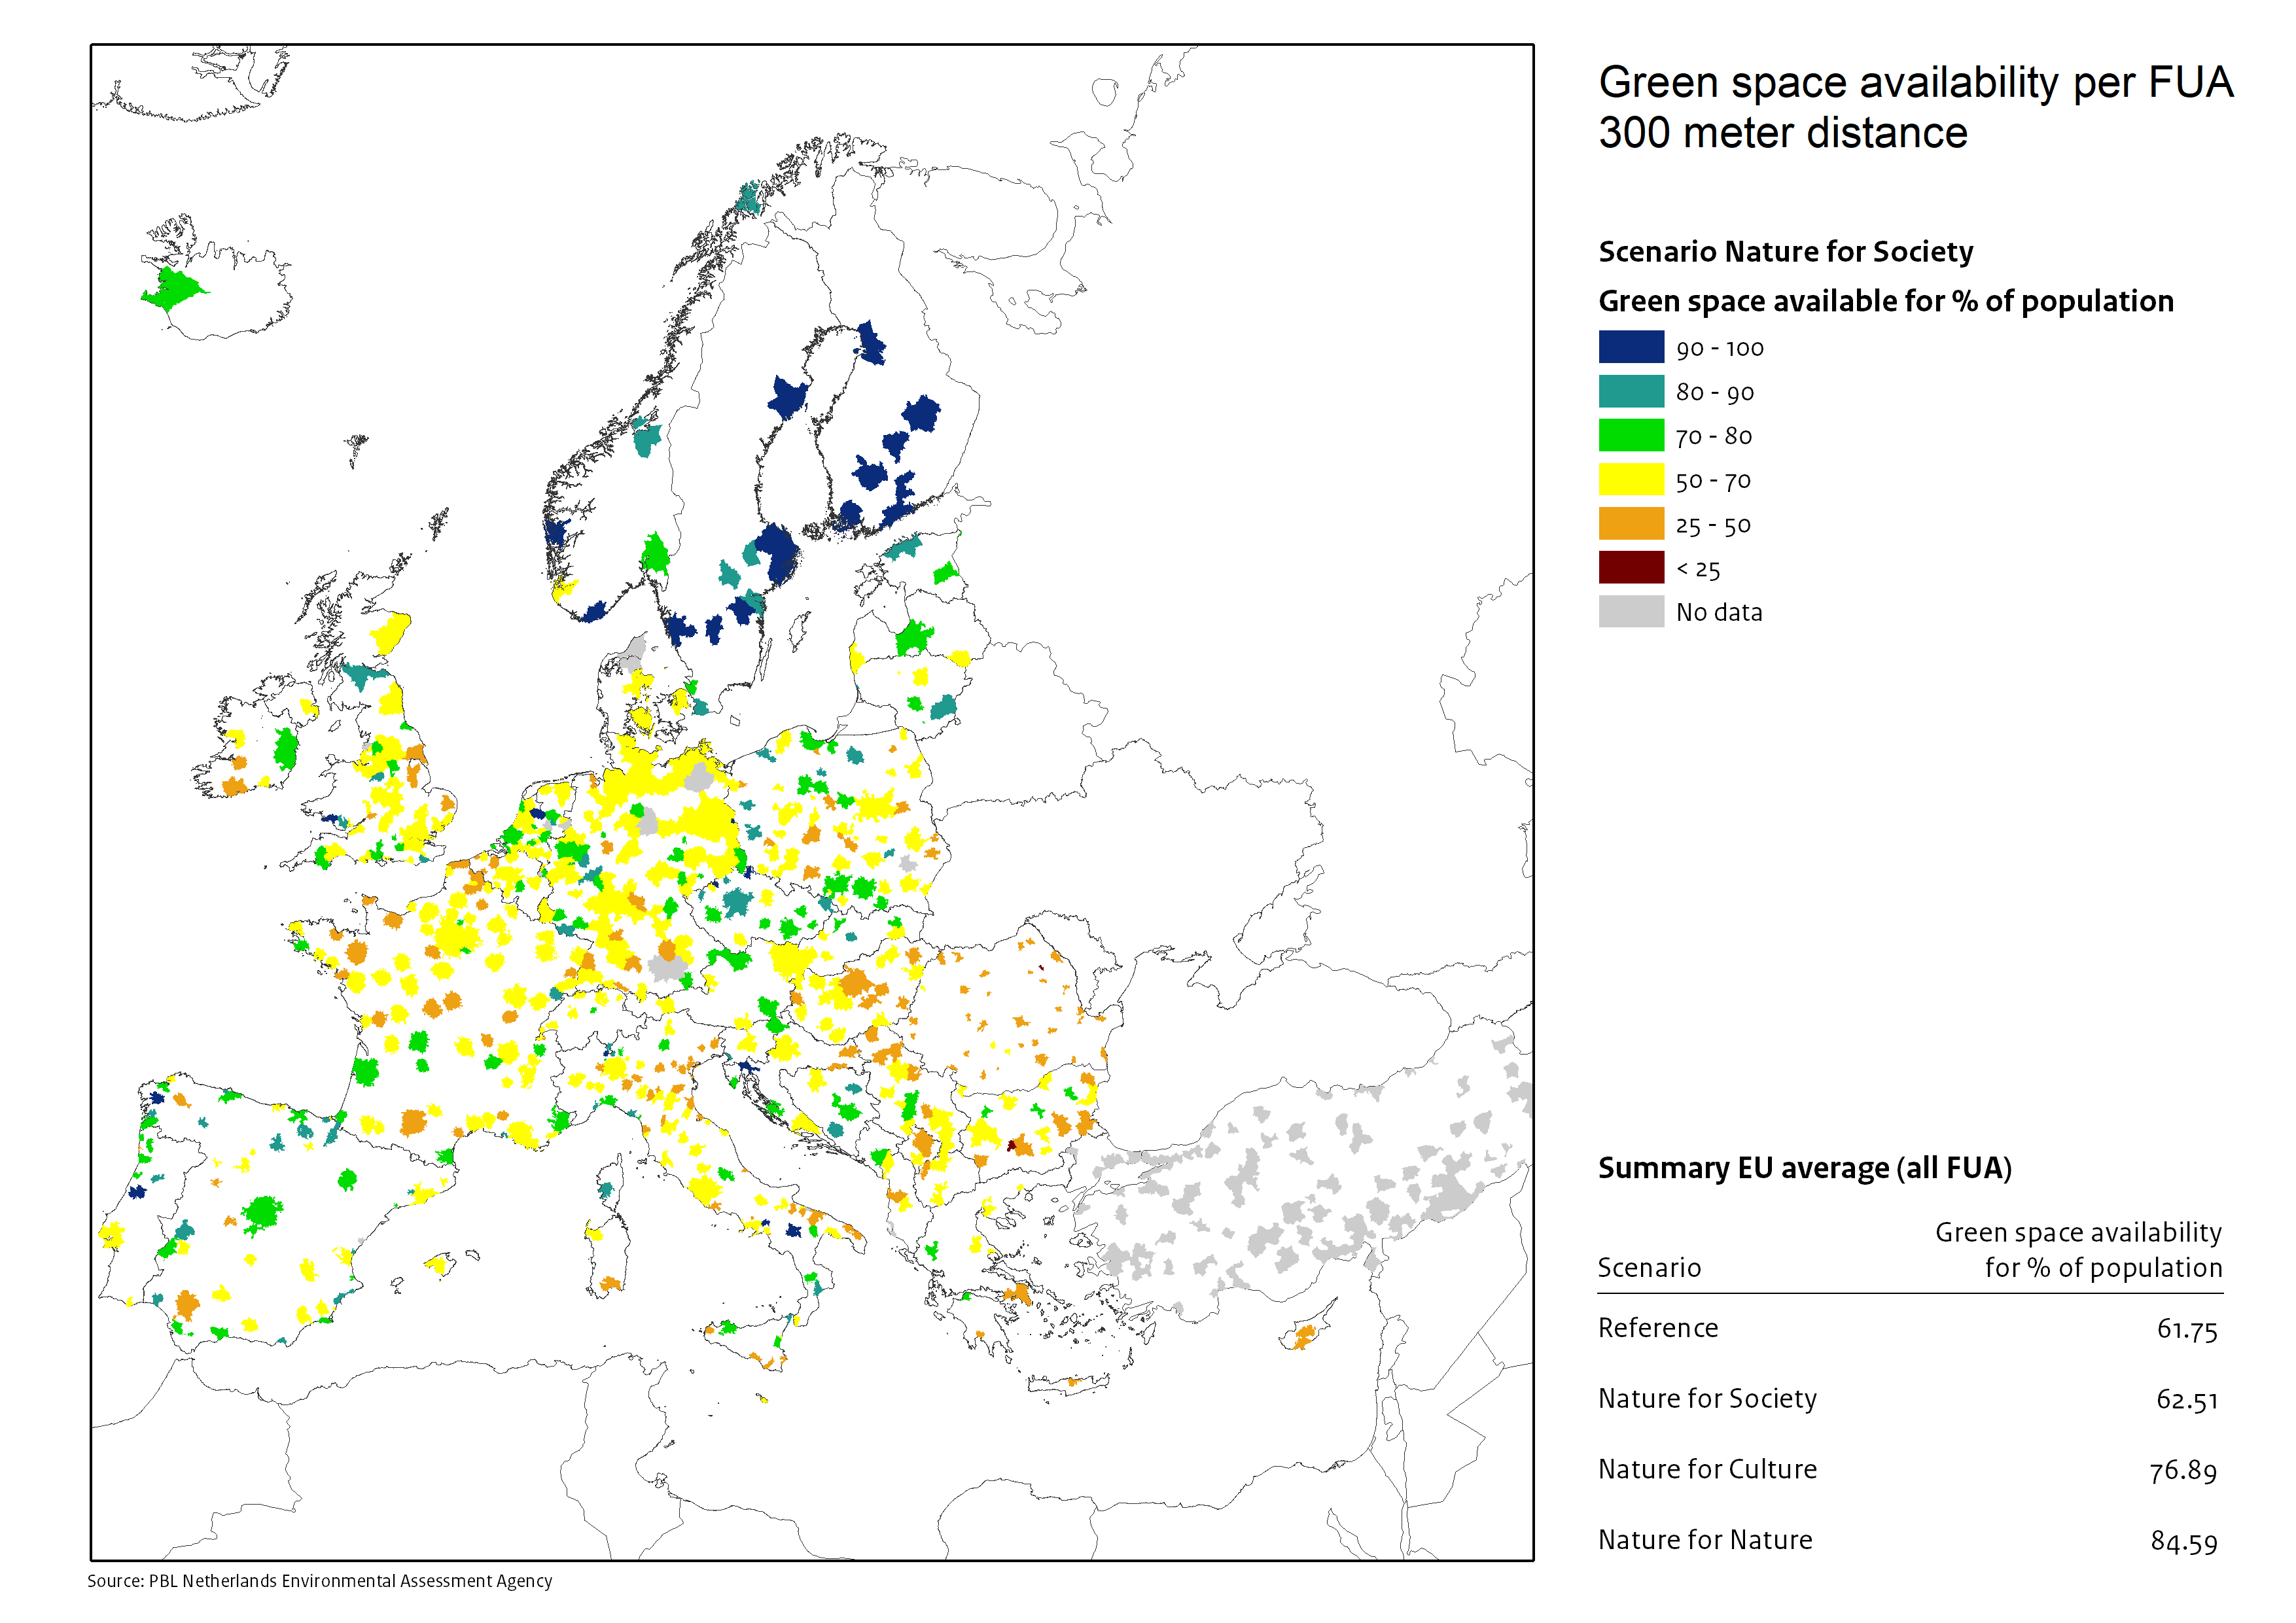
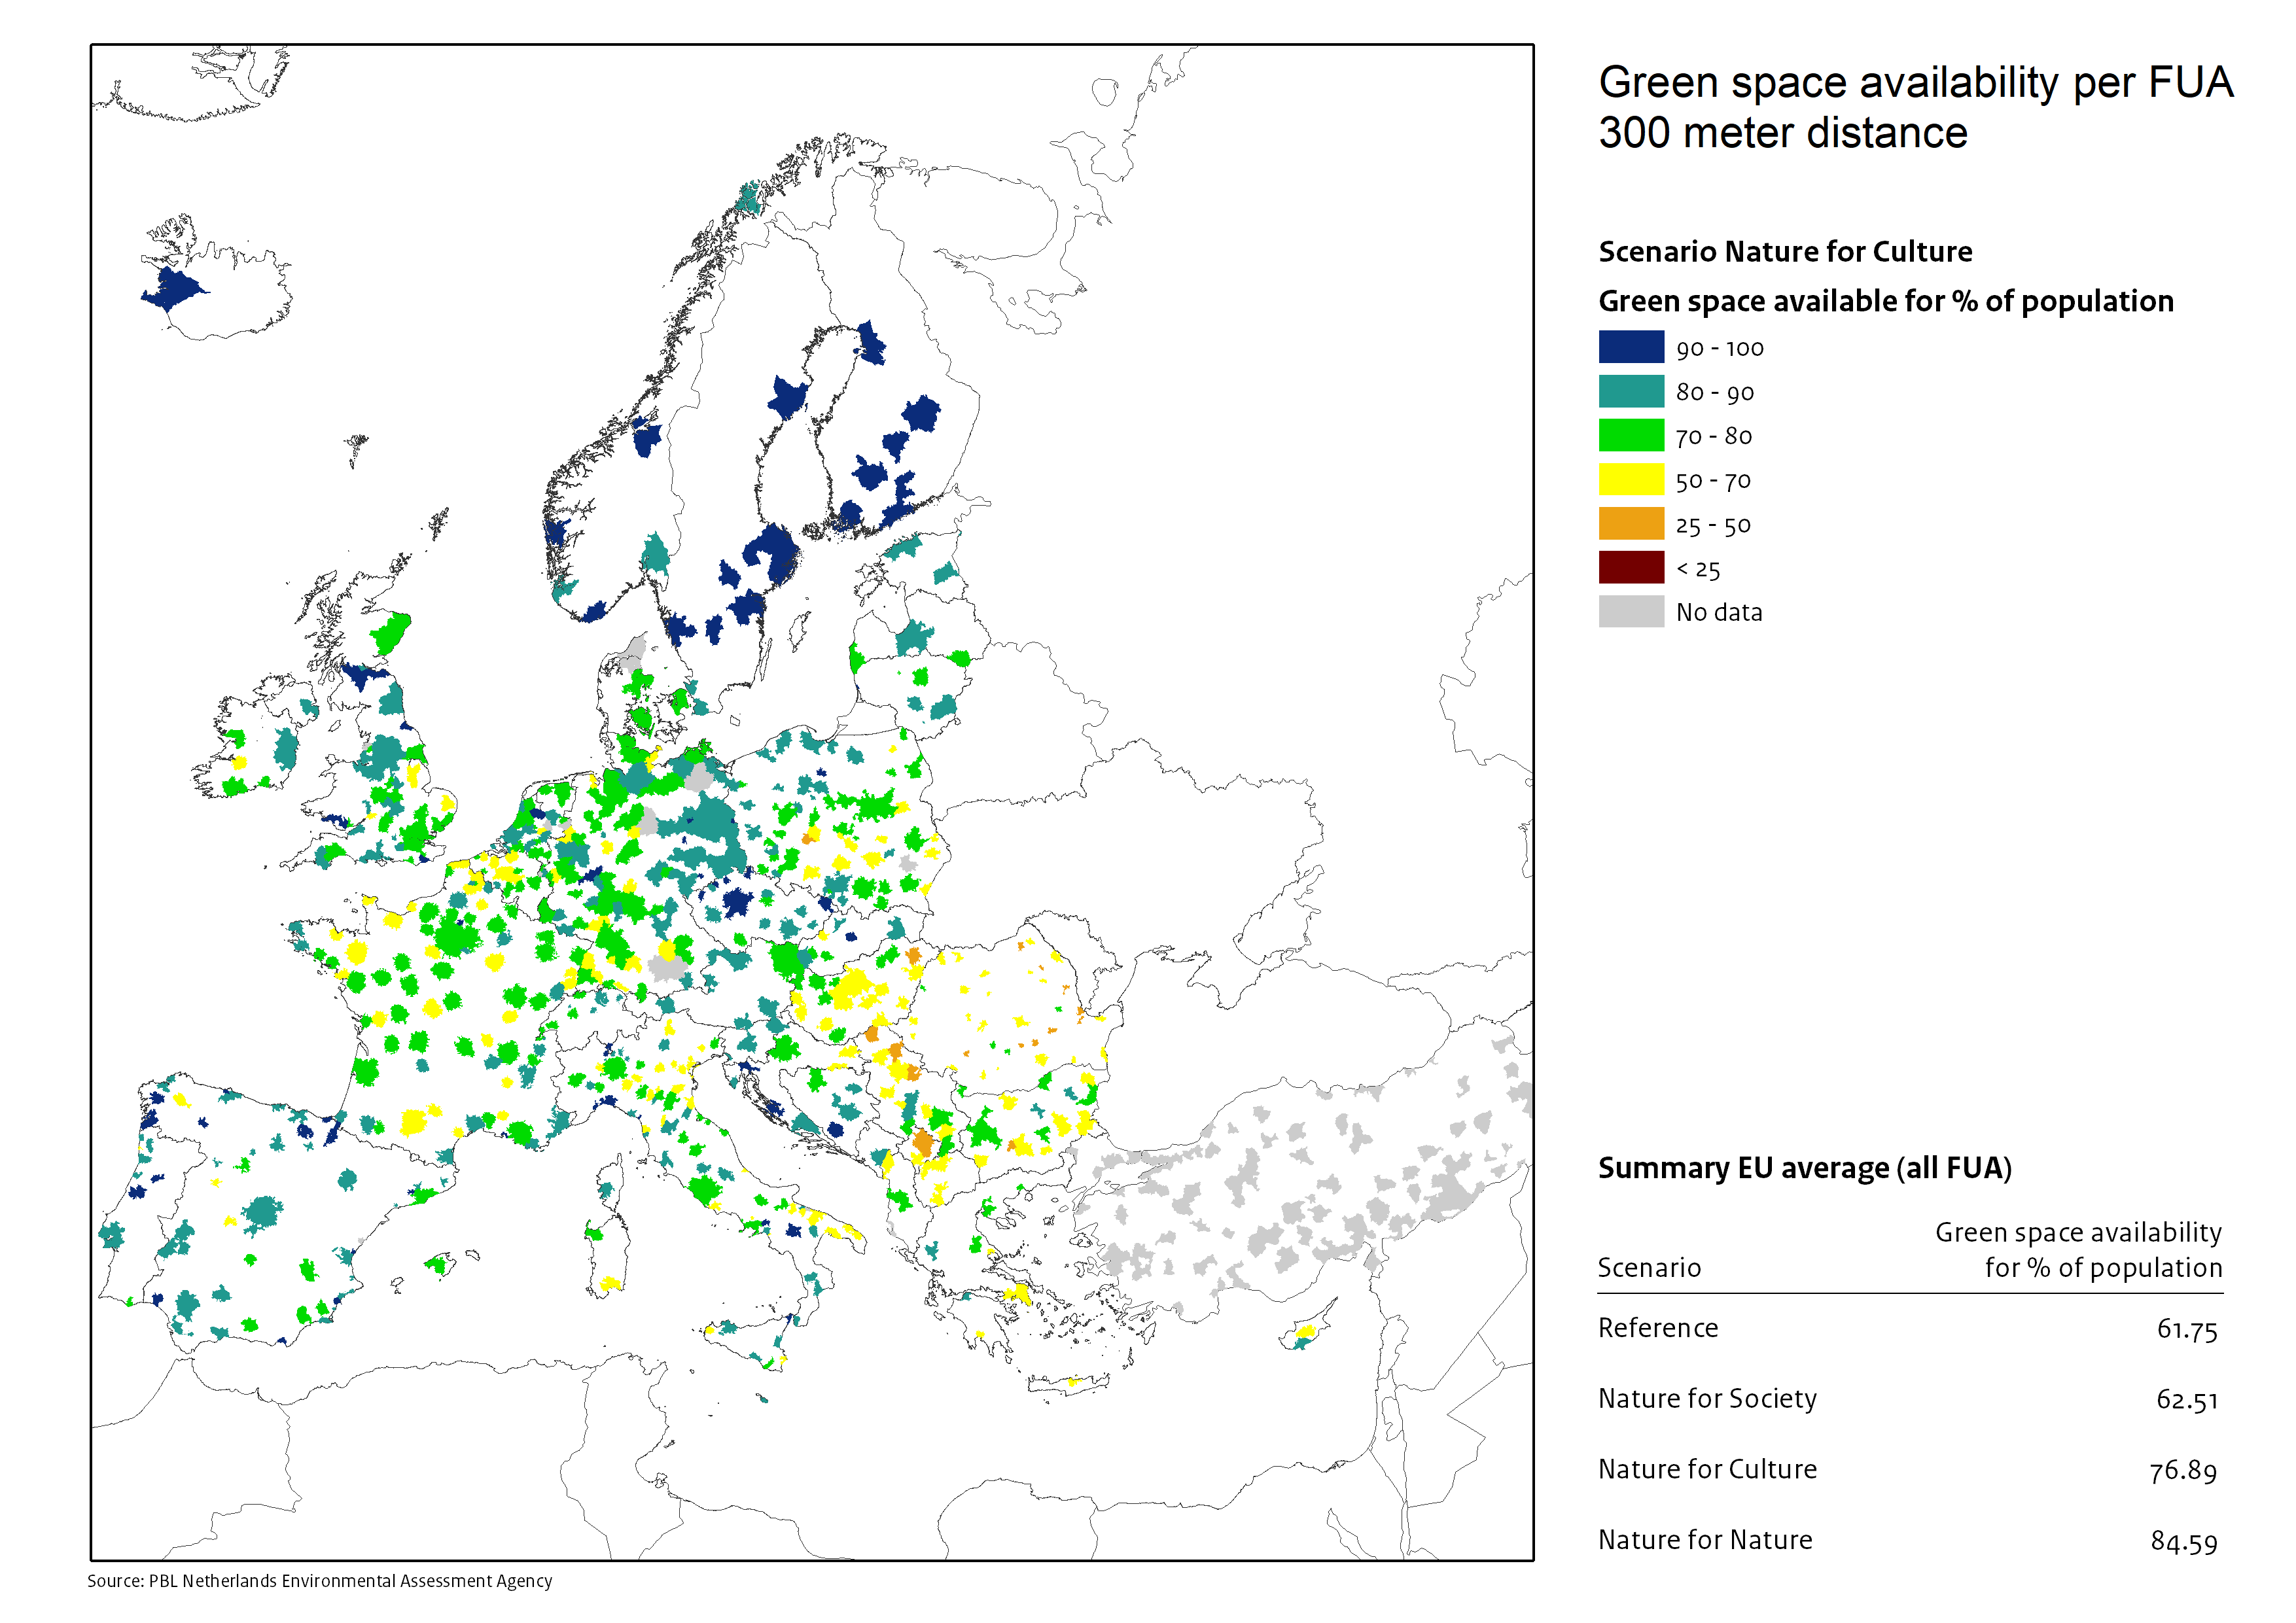
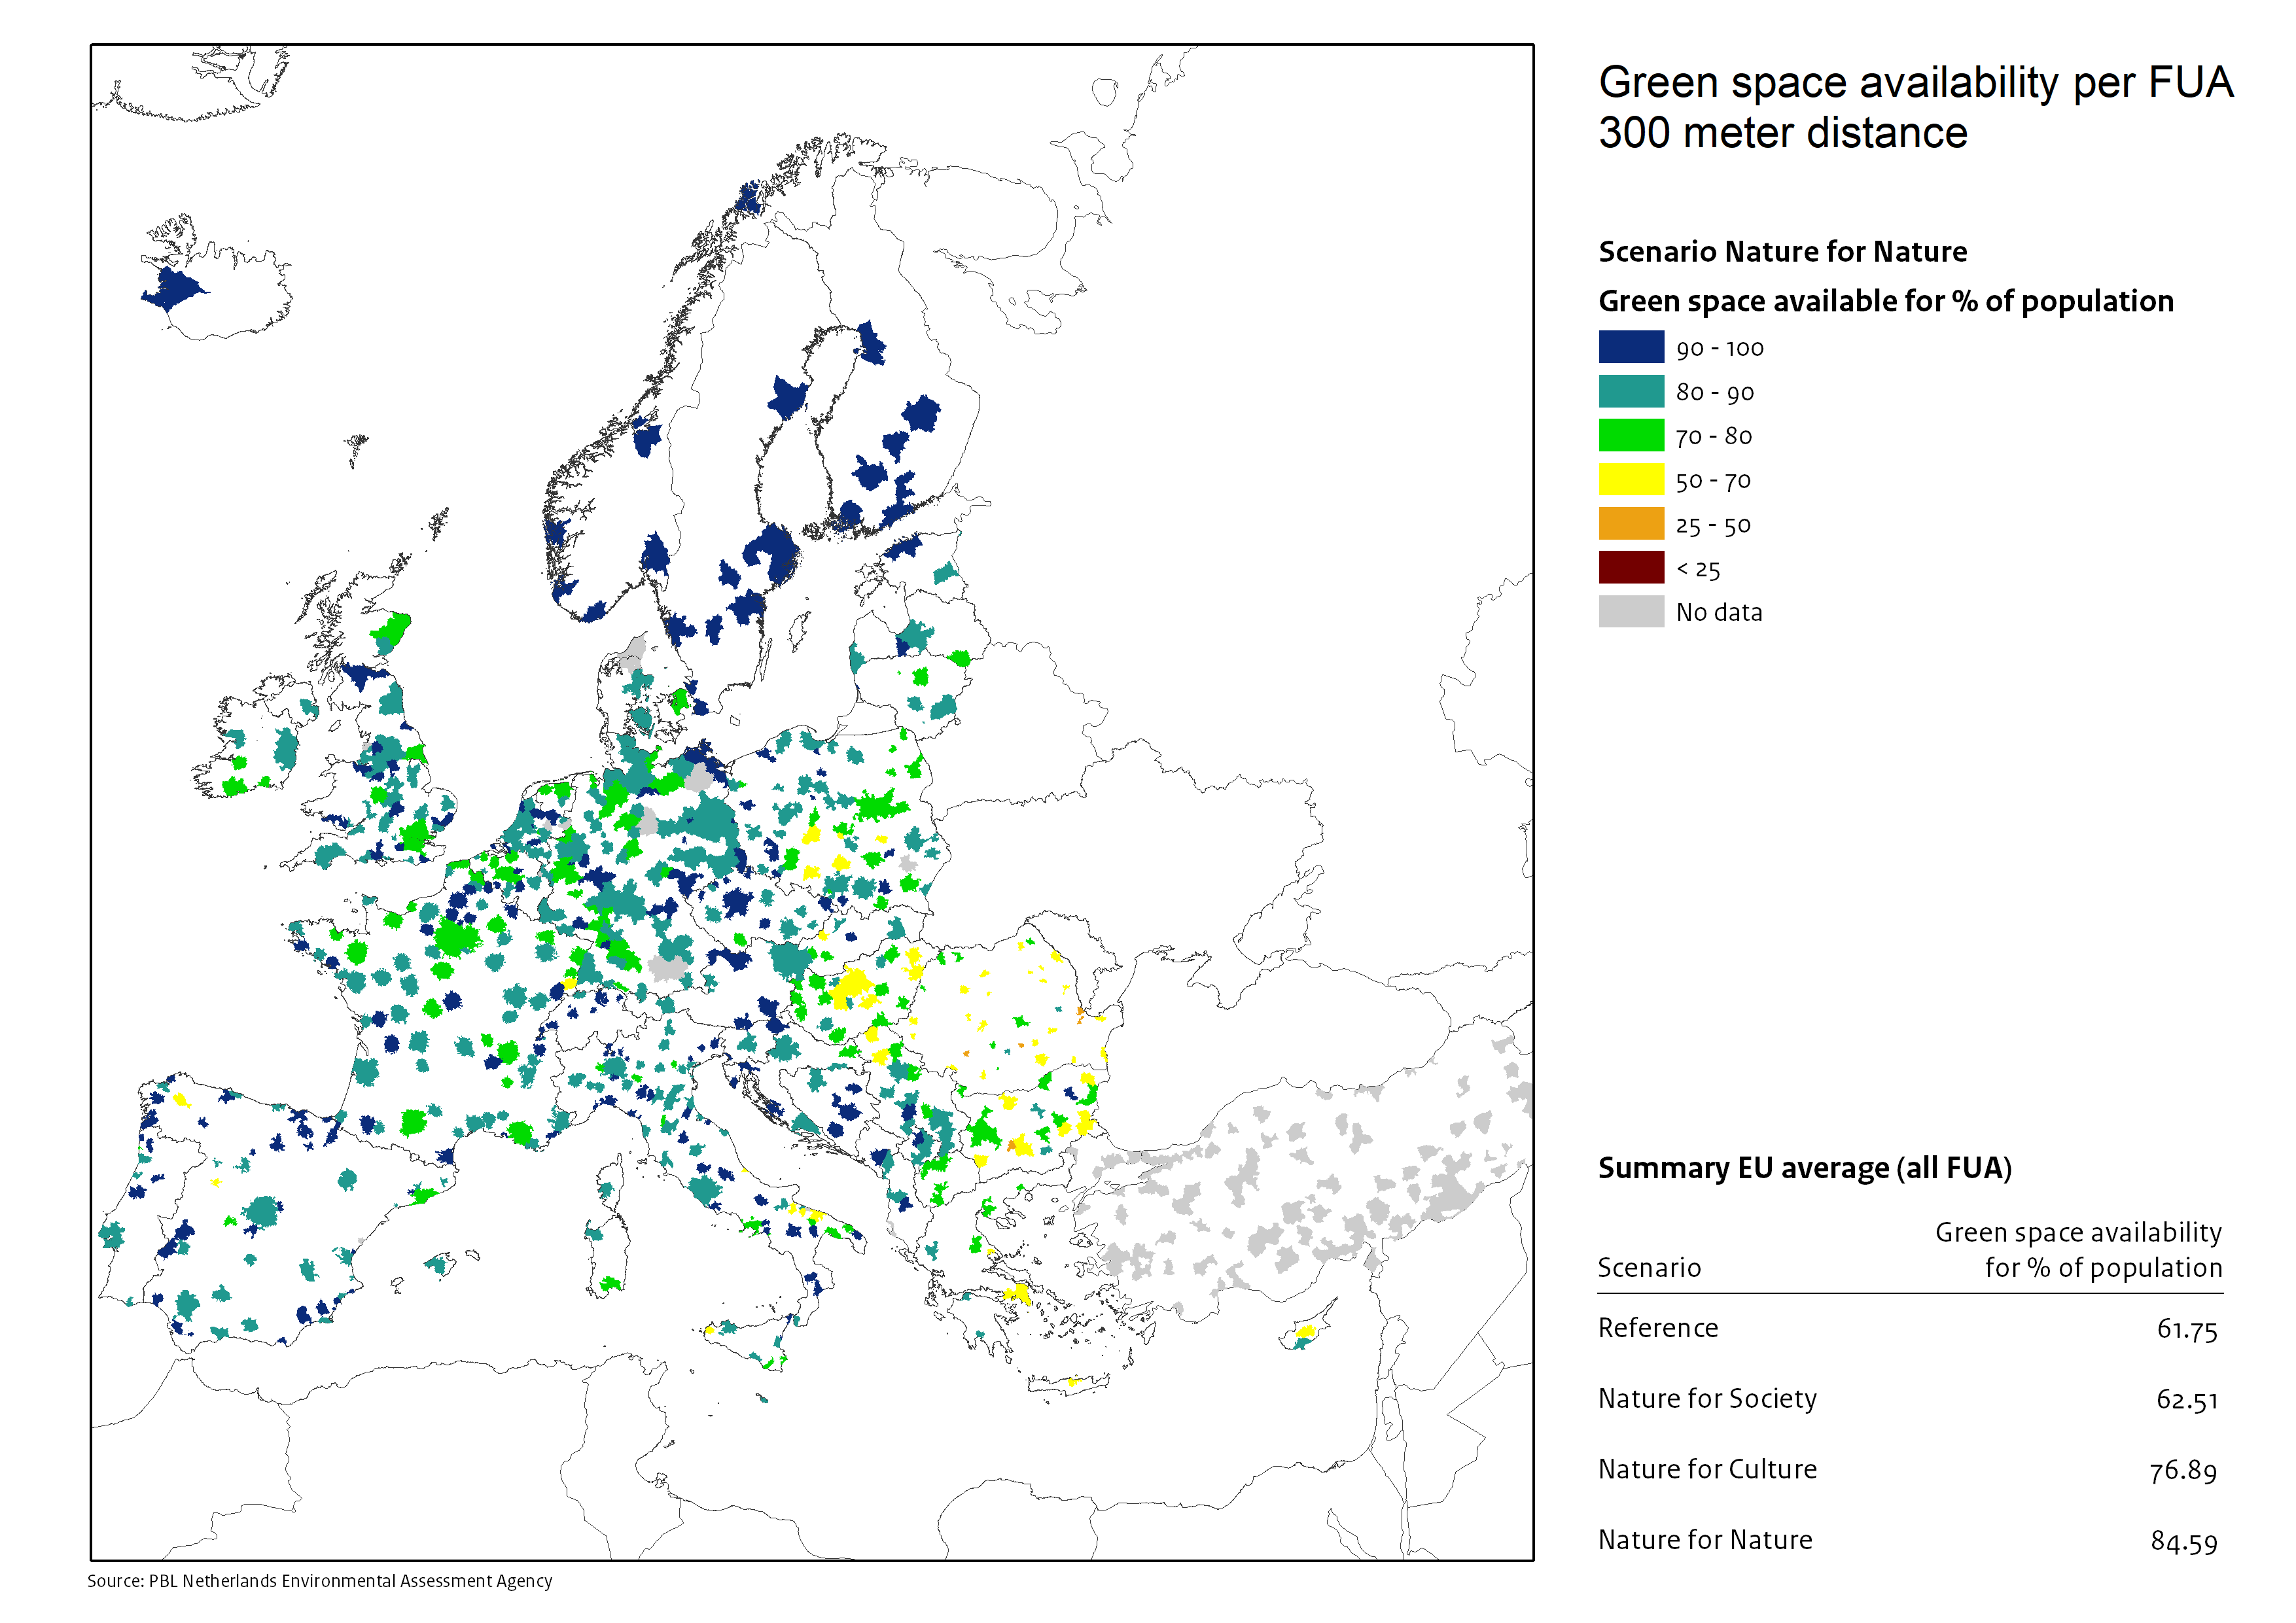
These maps demonstrate the potential of nature-based solutions to address societal challenges, such as climate change, public health issues and loss of biodiversity, across more than 700 European cities.
We used a scenario-based modelling approach to quantify and map multiple benefits of existing urban nature-based solutions as well as explored future potentials of nature-based solutions in cities . These scenarios envision different future urban developments, while giving recognition to the plurality of values on (urban) nature.
To learn more about the method and how to use the open access digital maps, read our general brief as well as our background brief on how we mapped the benefits across European urban areas. For more information on available nature-based solutions assessment methods please check out the Urban Nature Navigator.
Select among the different benefits and scenarios and the maps will show an average value across all European cities under the selected scenarios. You can also select a city from the table below, and download maps showing the potential of nature-based solutions within your city of interest.
Benefits
Scenario

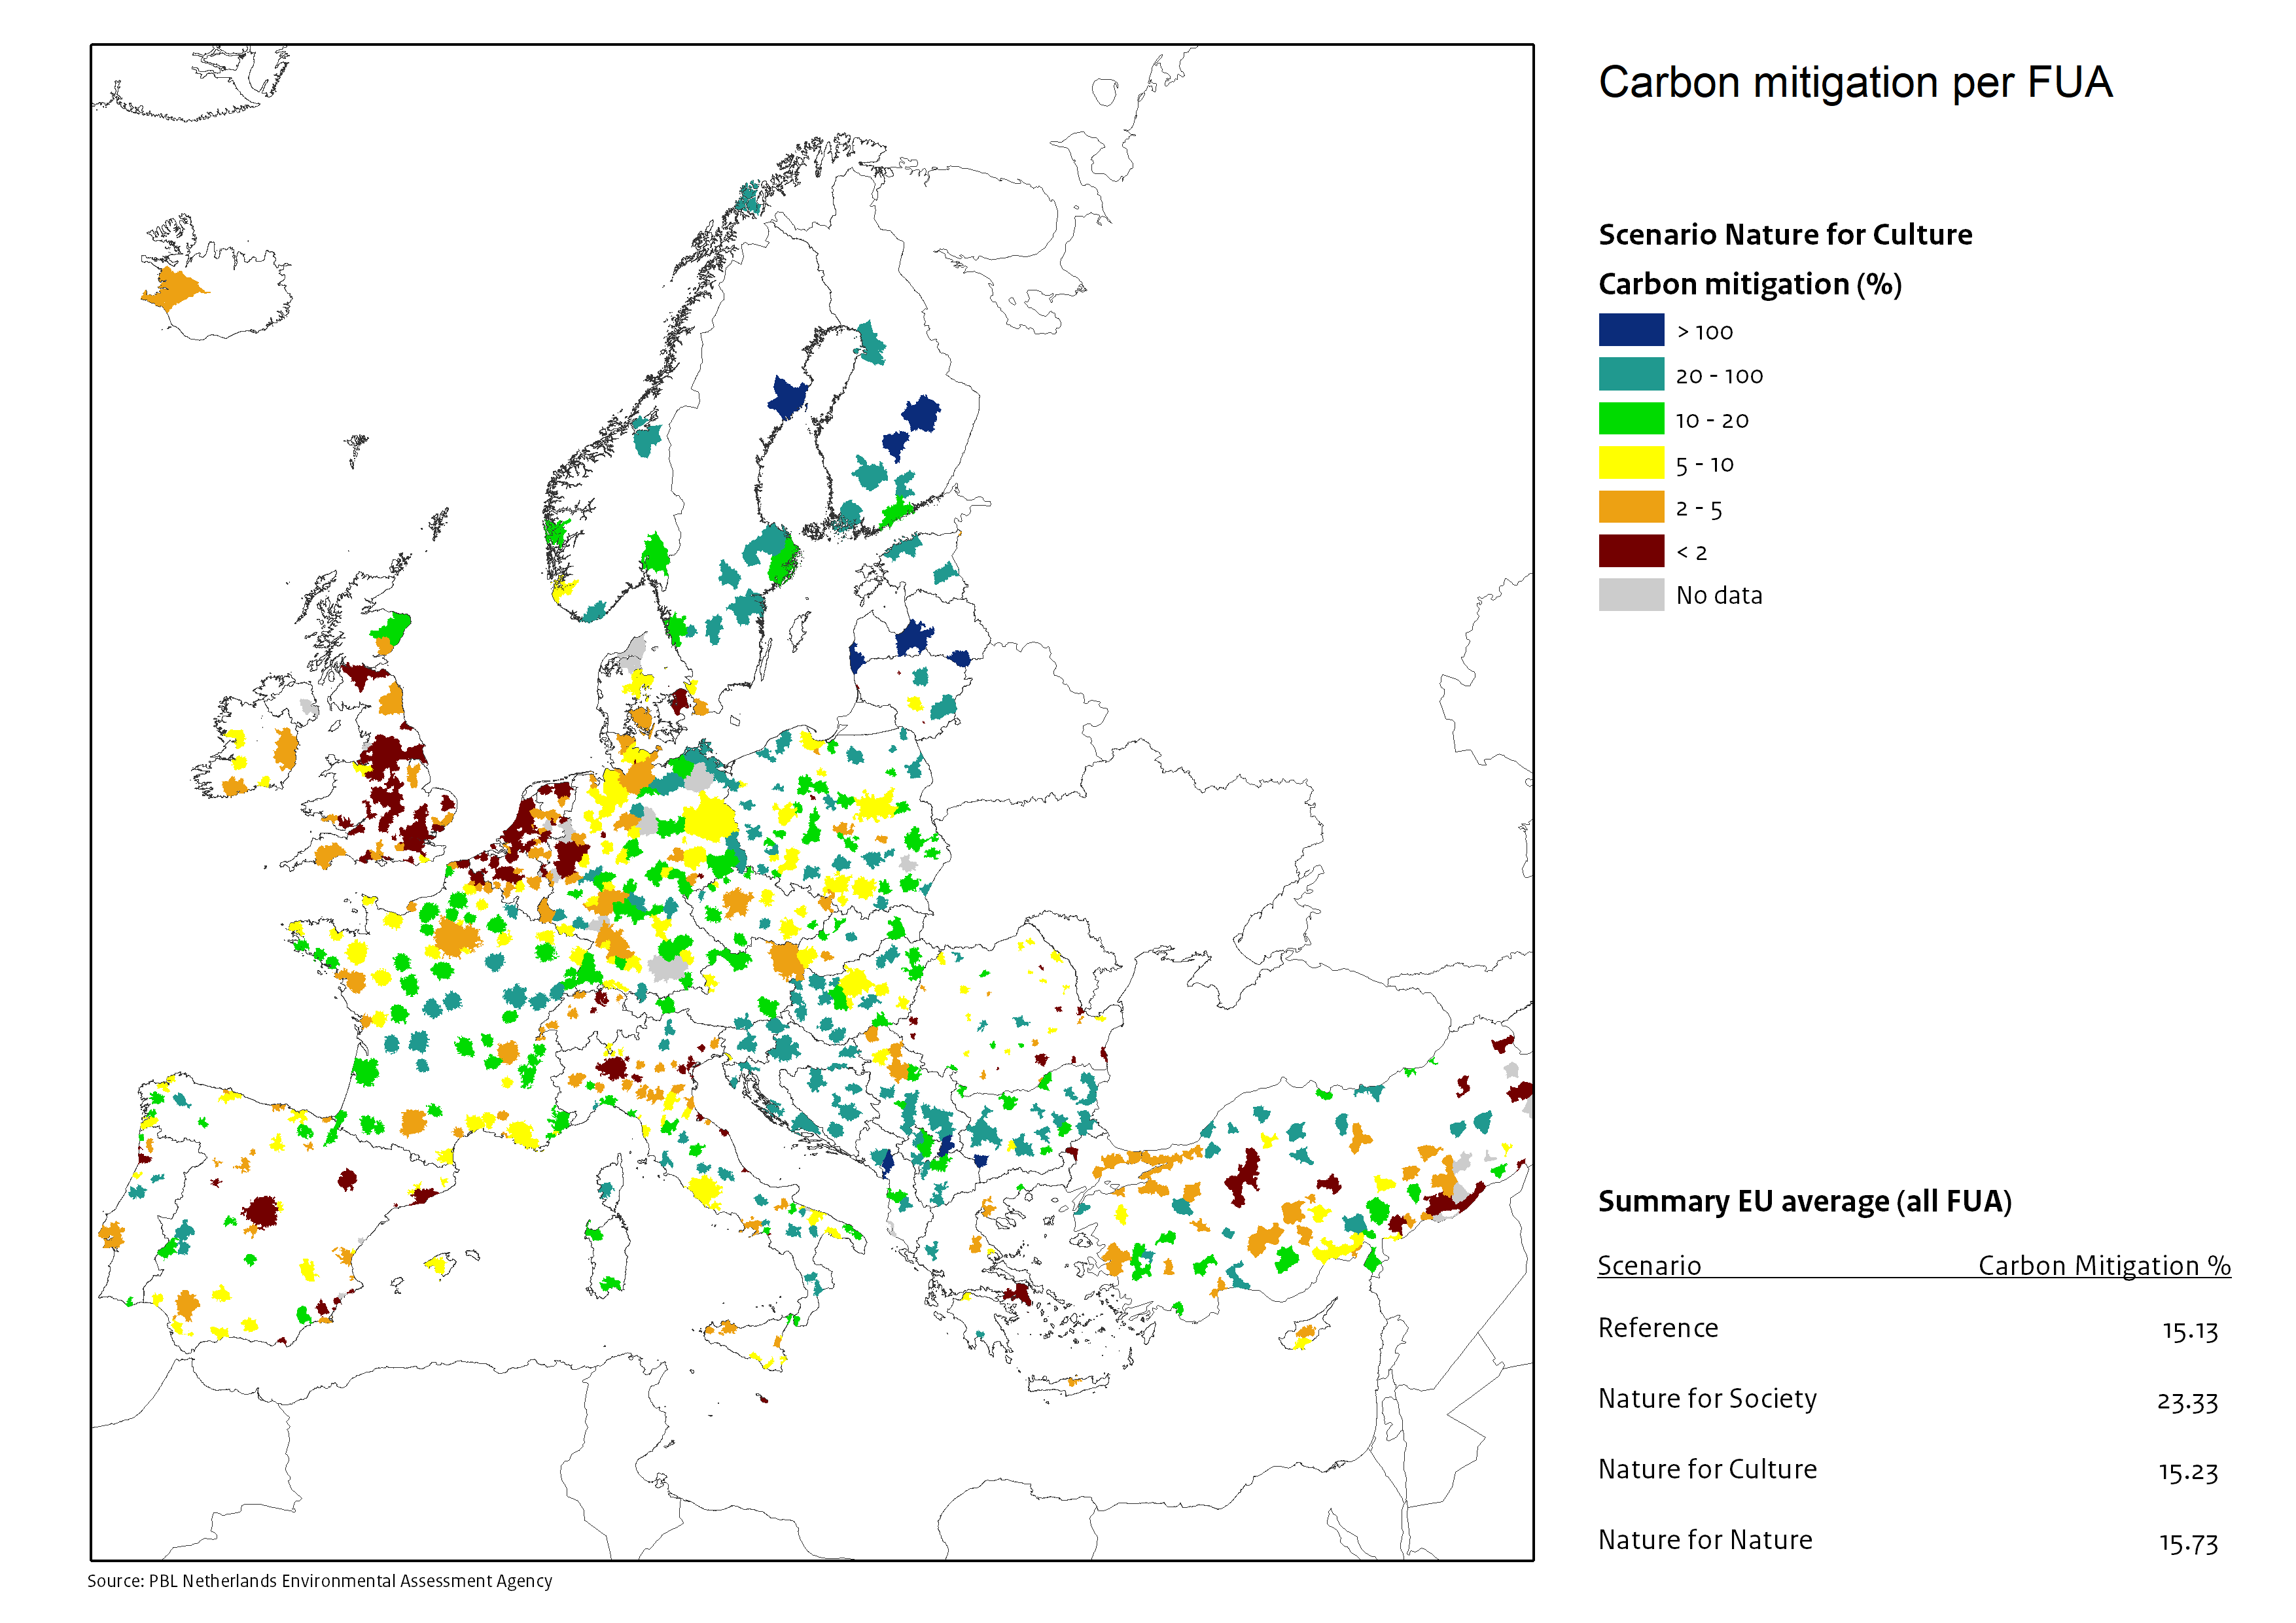
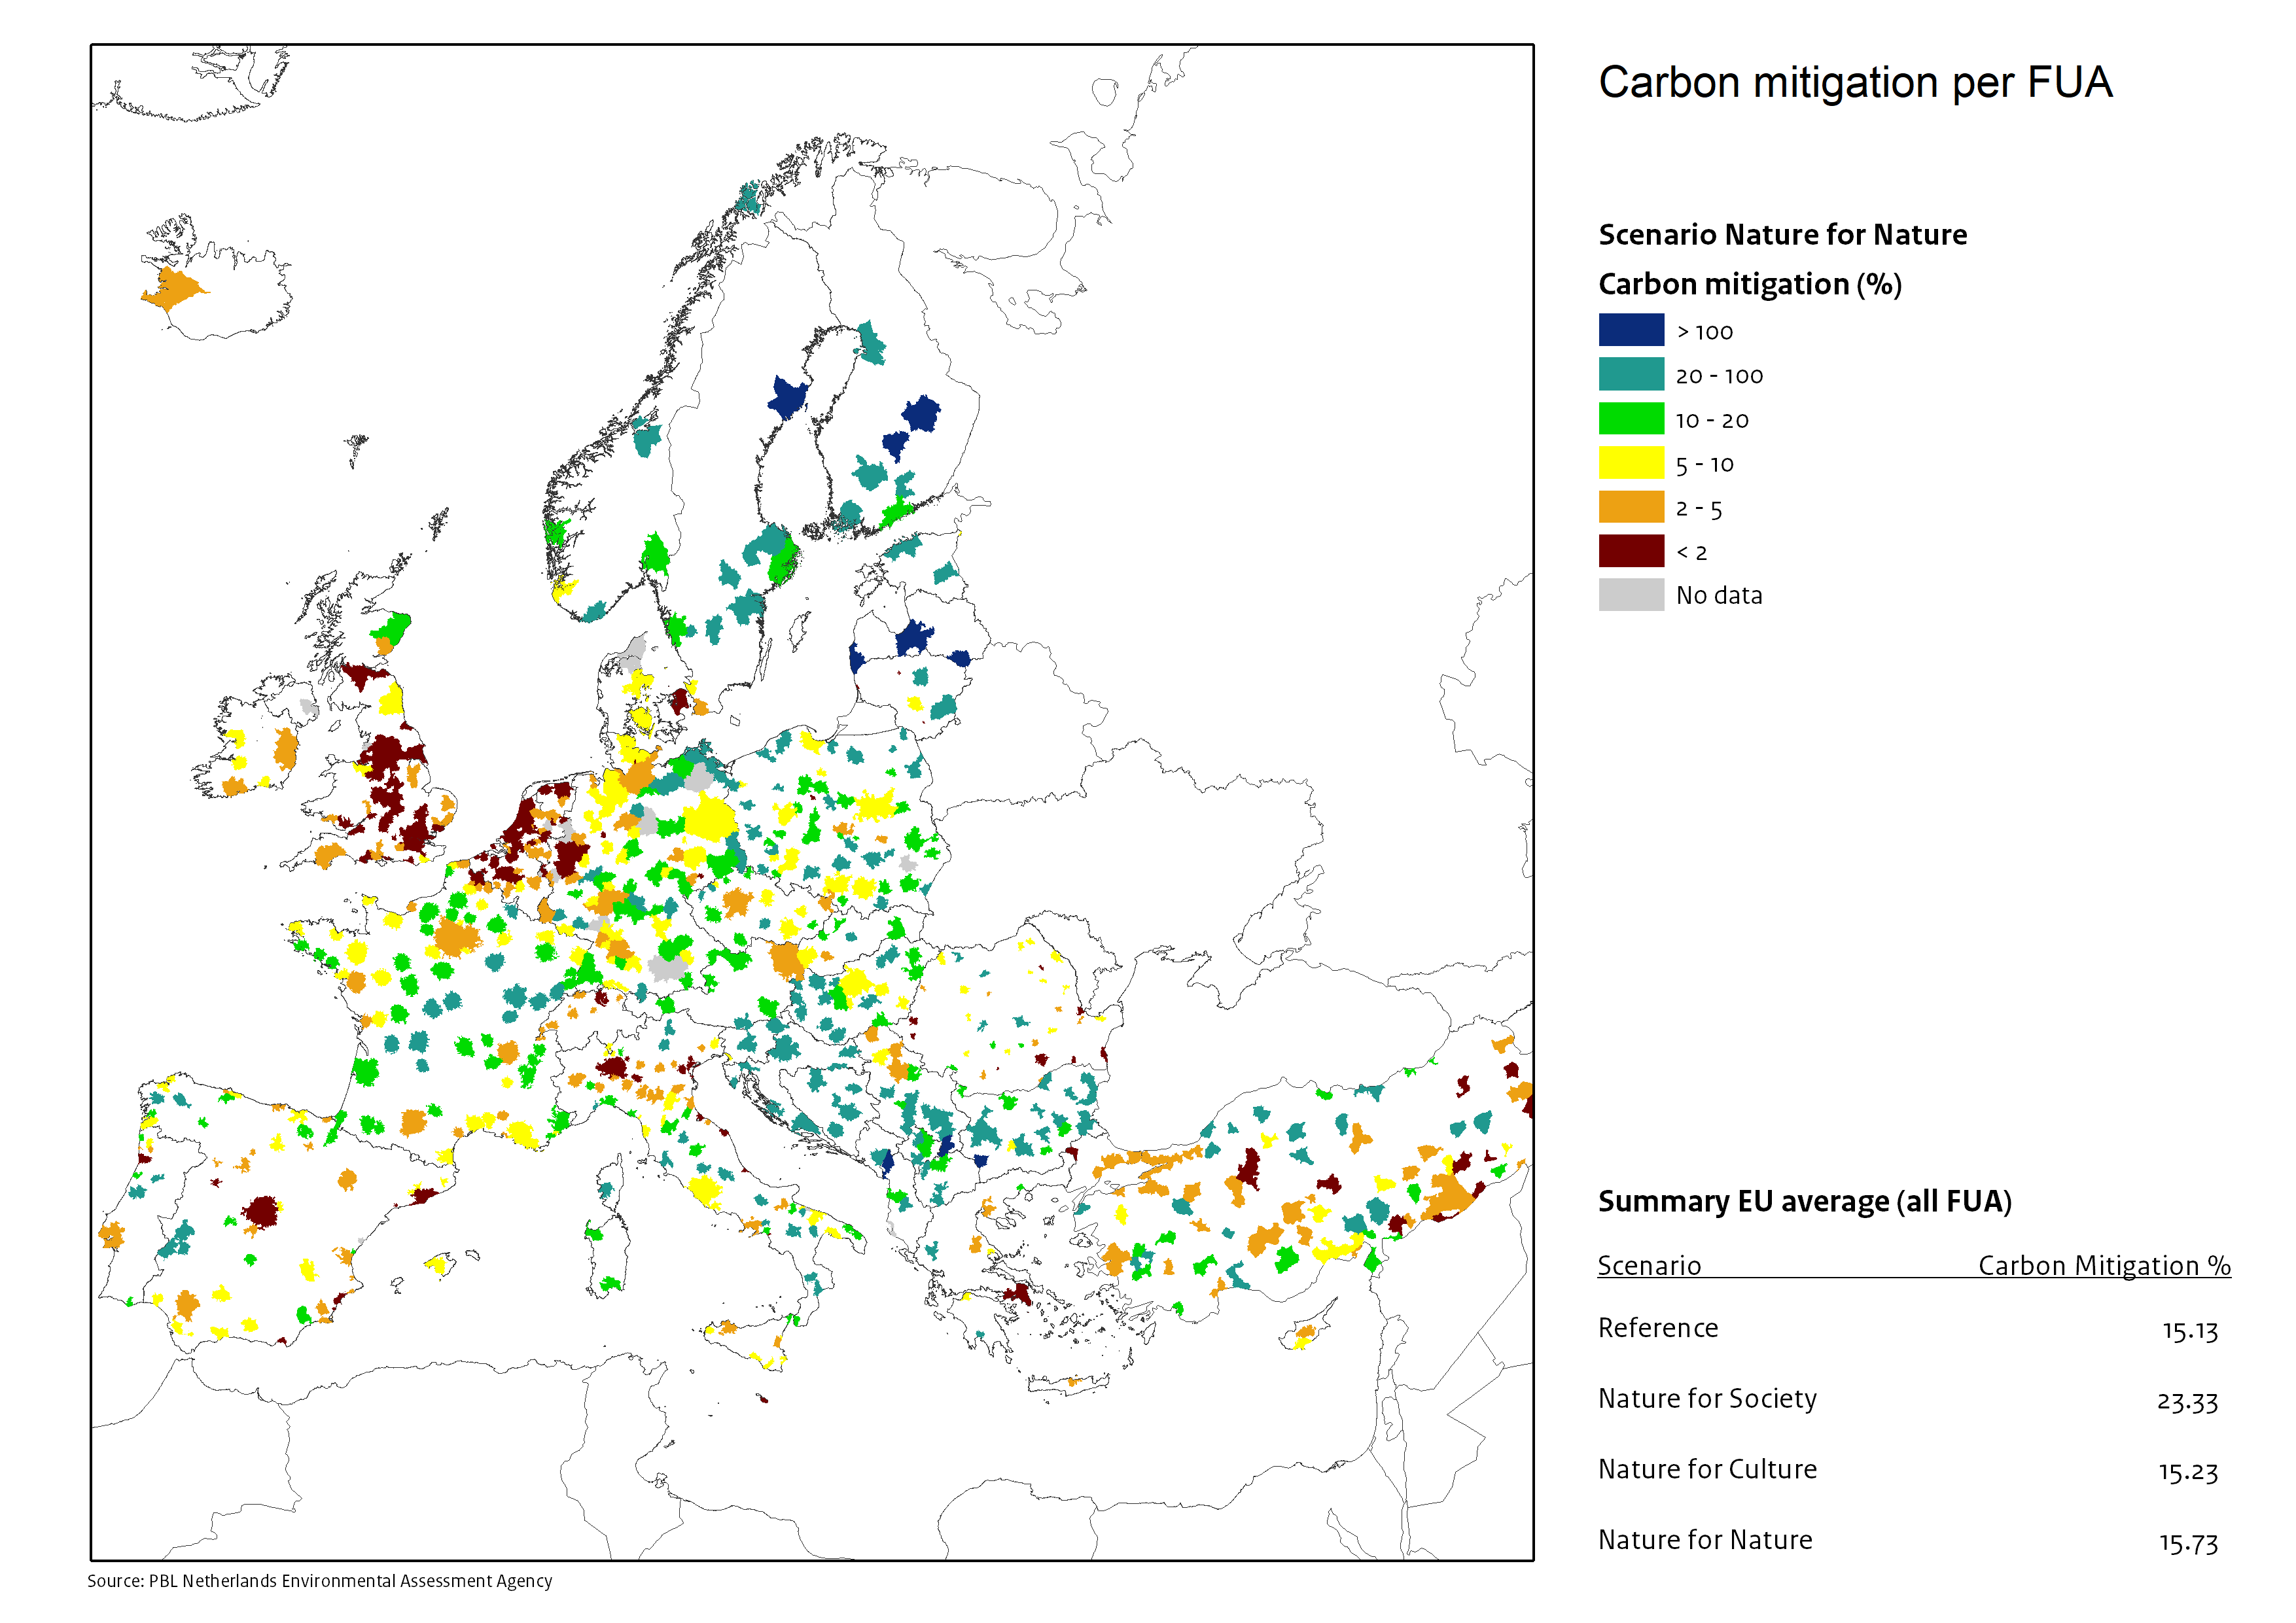
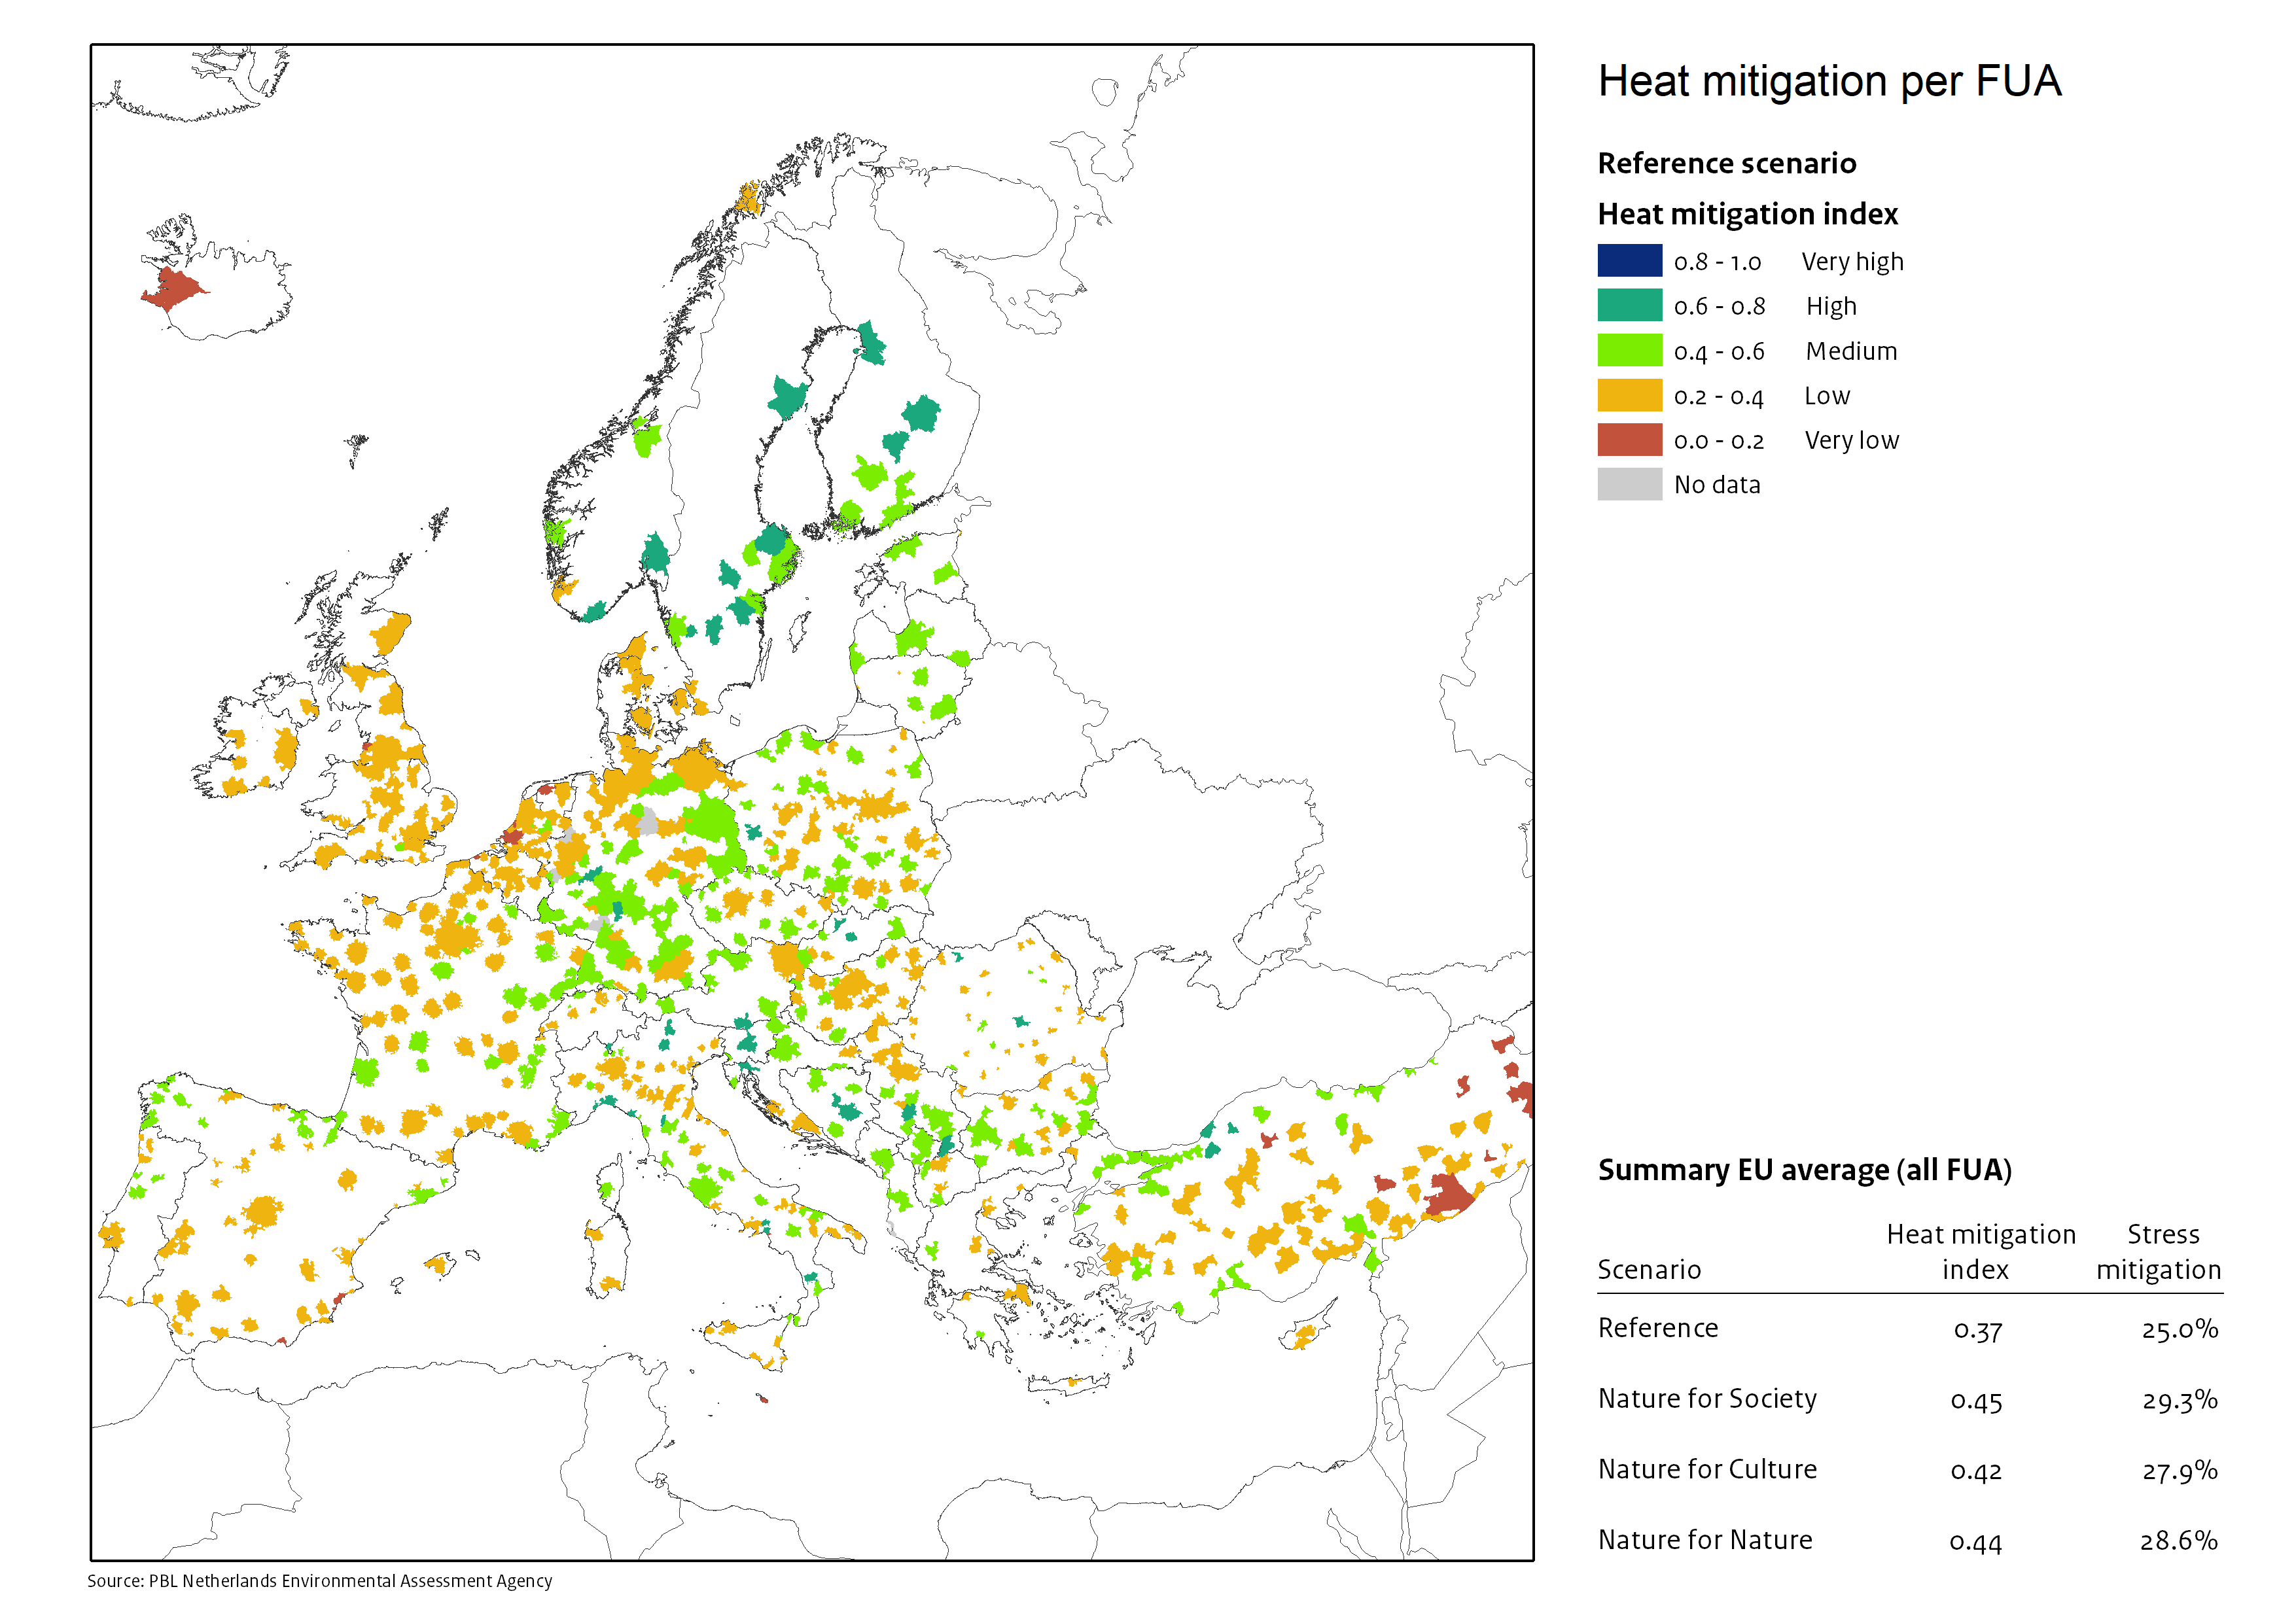
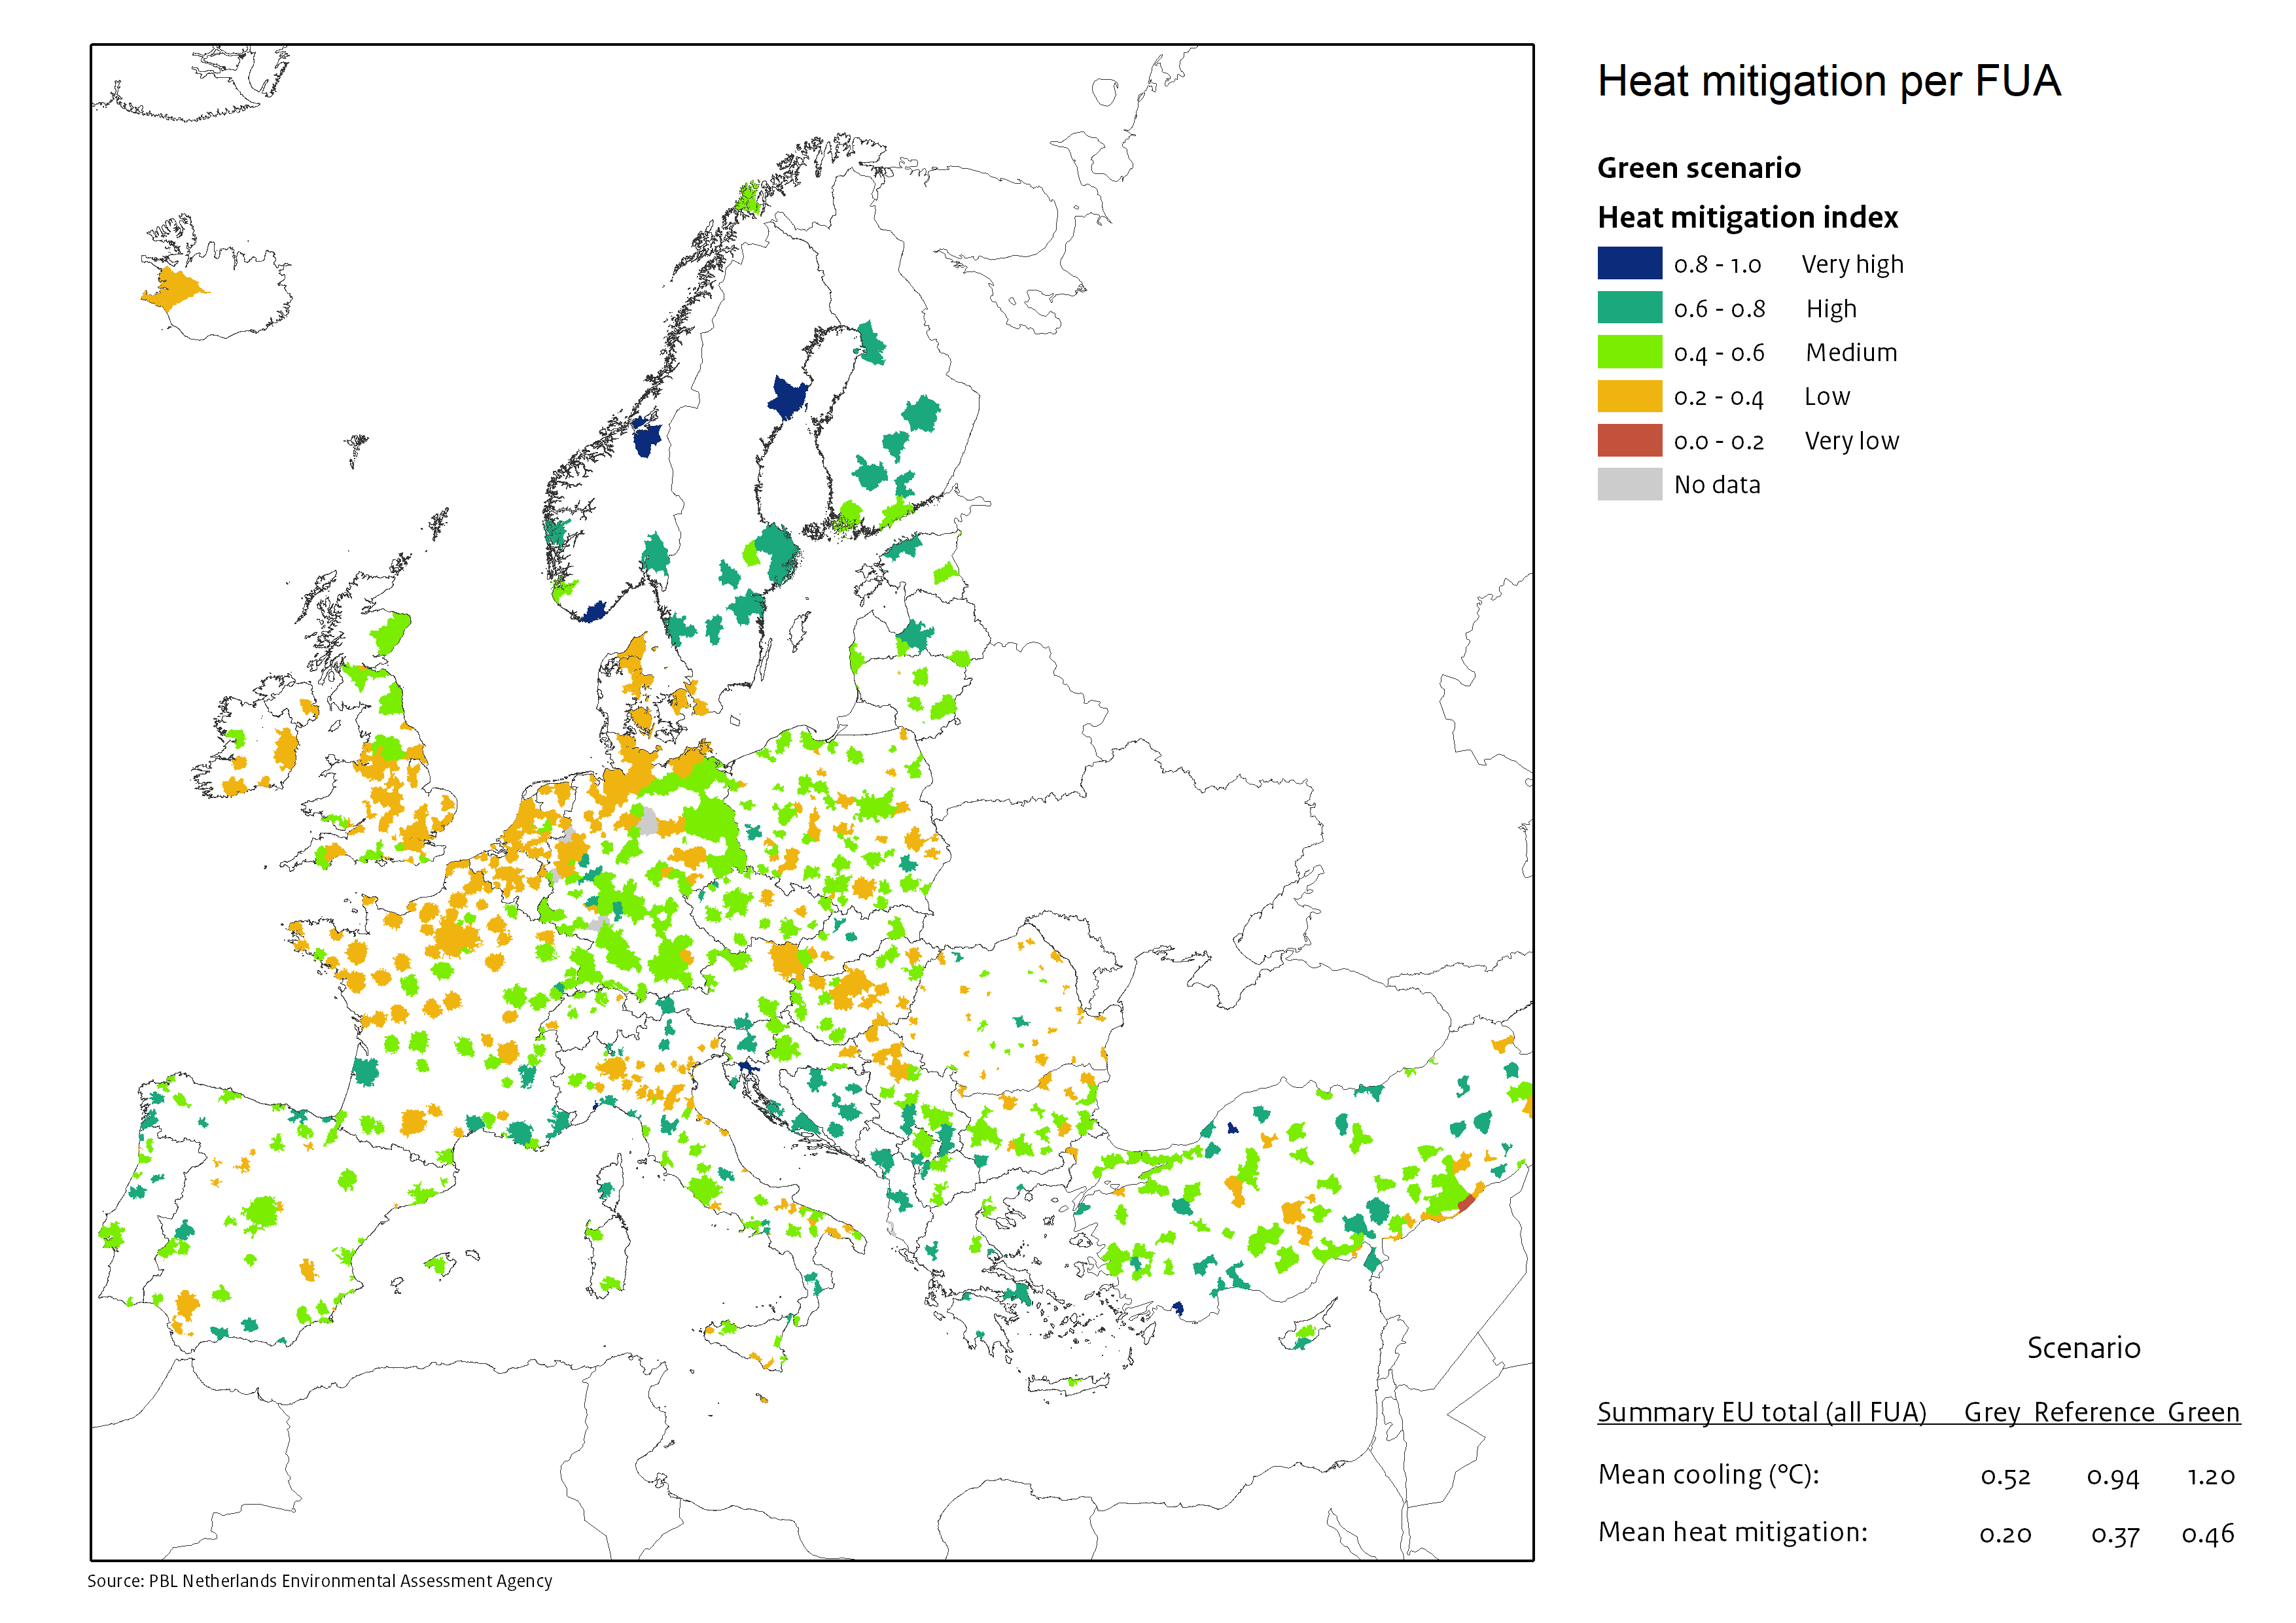
Scenarios of future cities
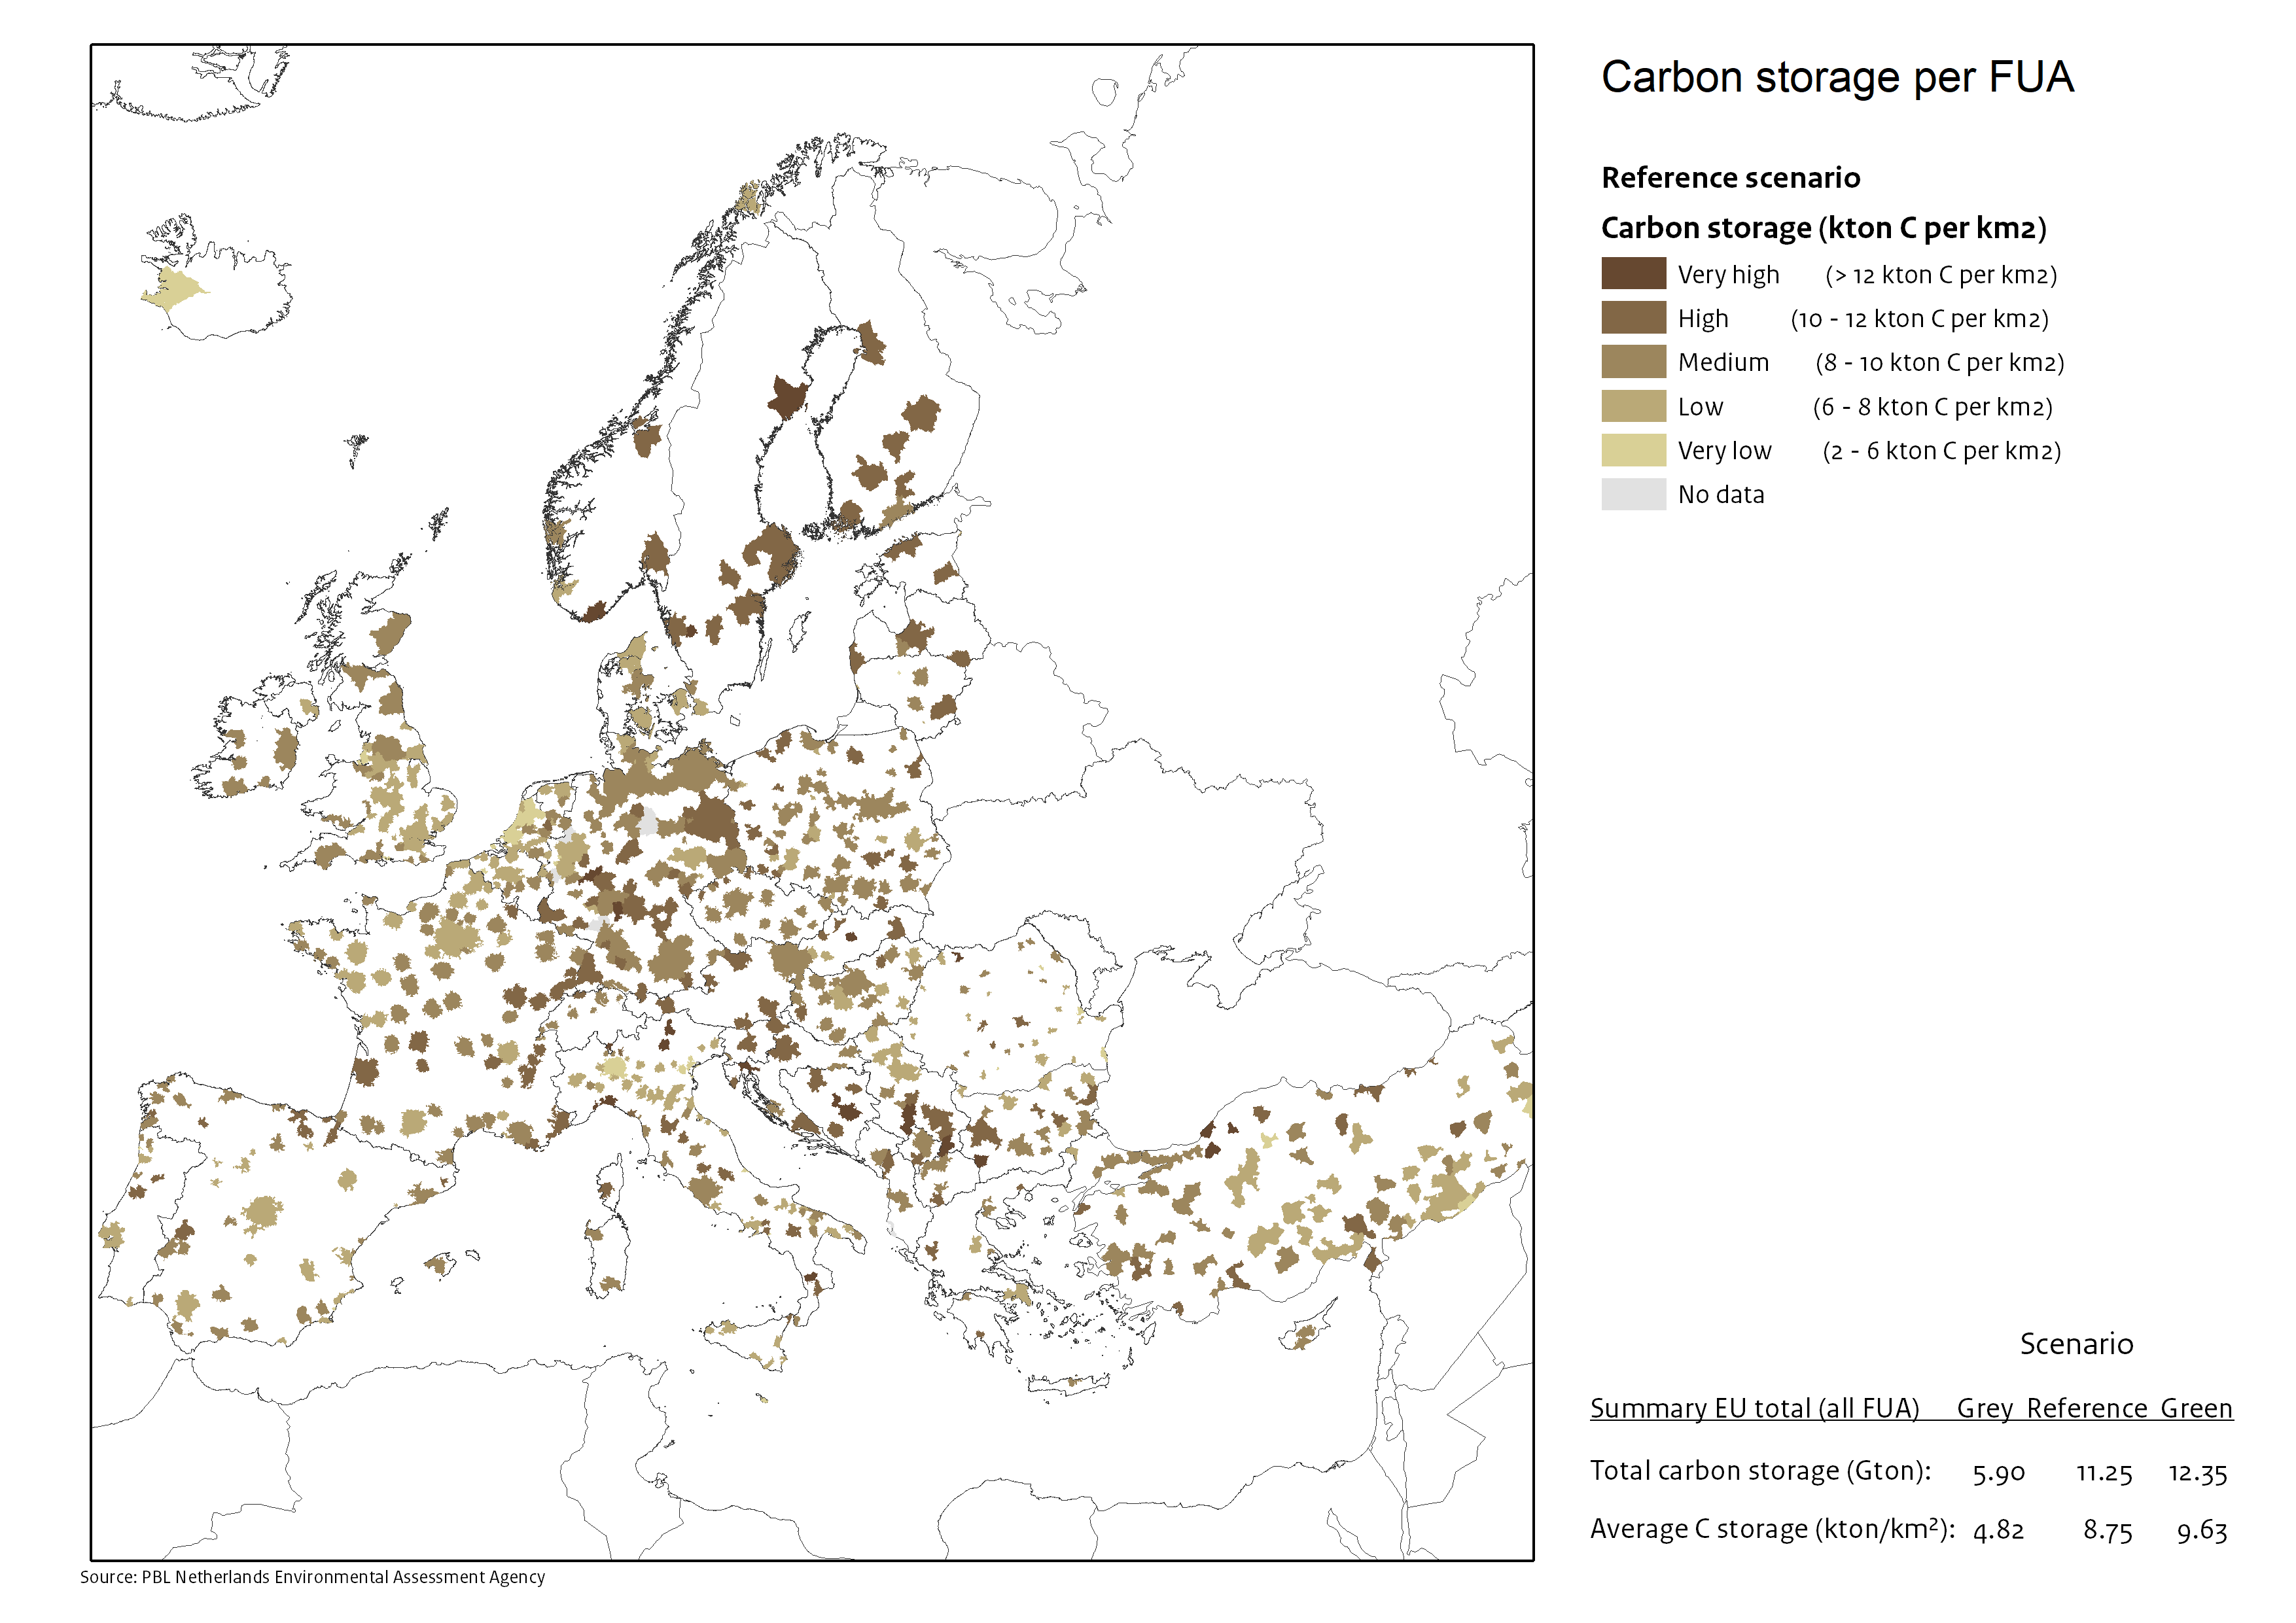
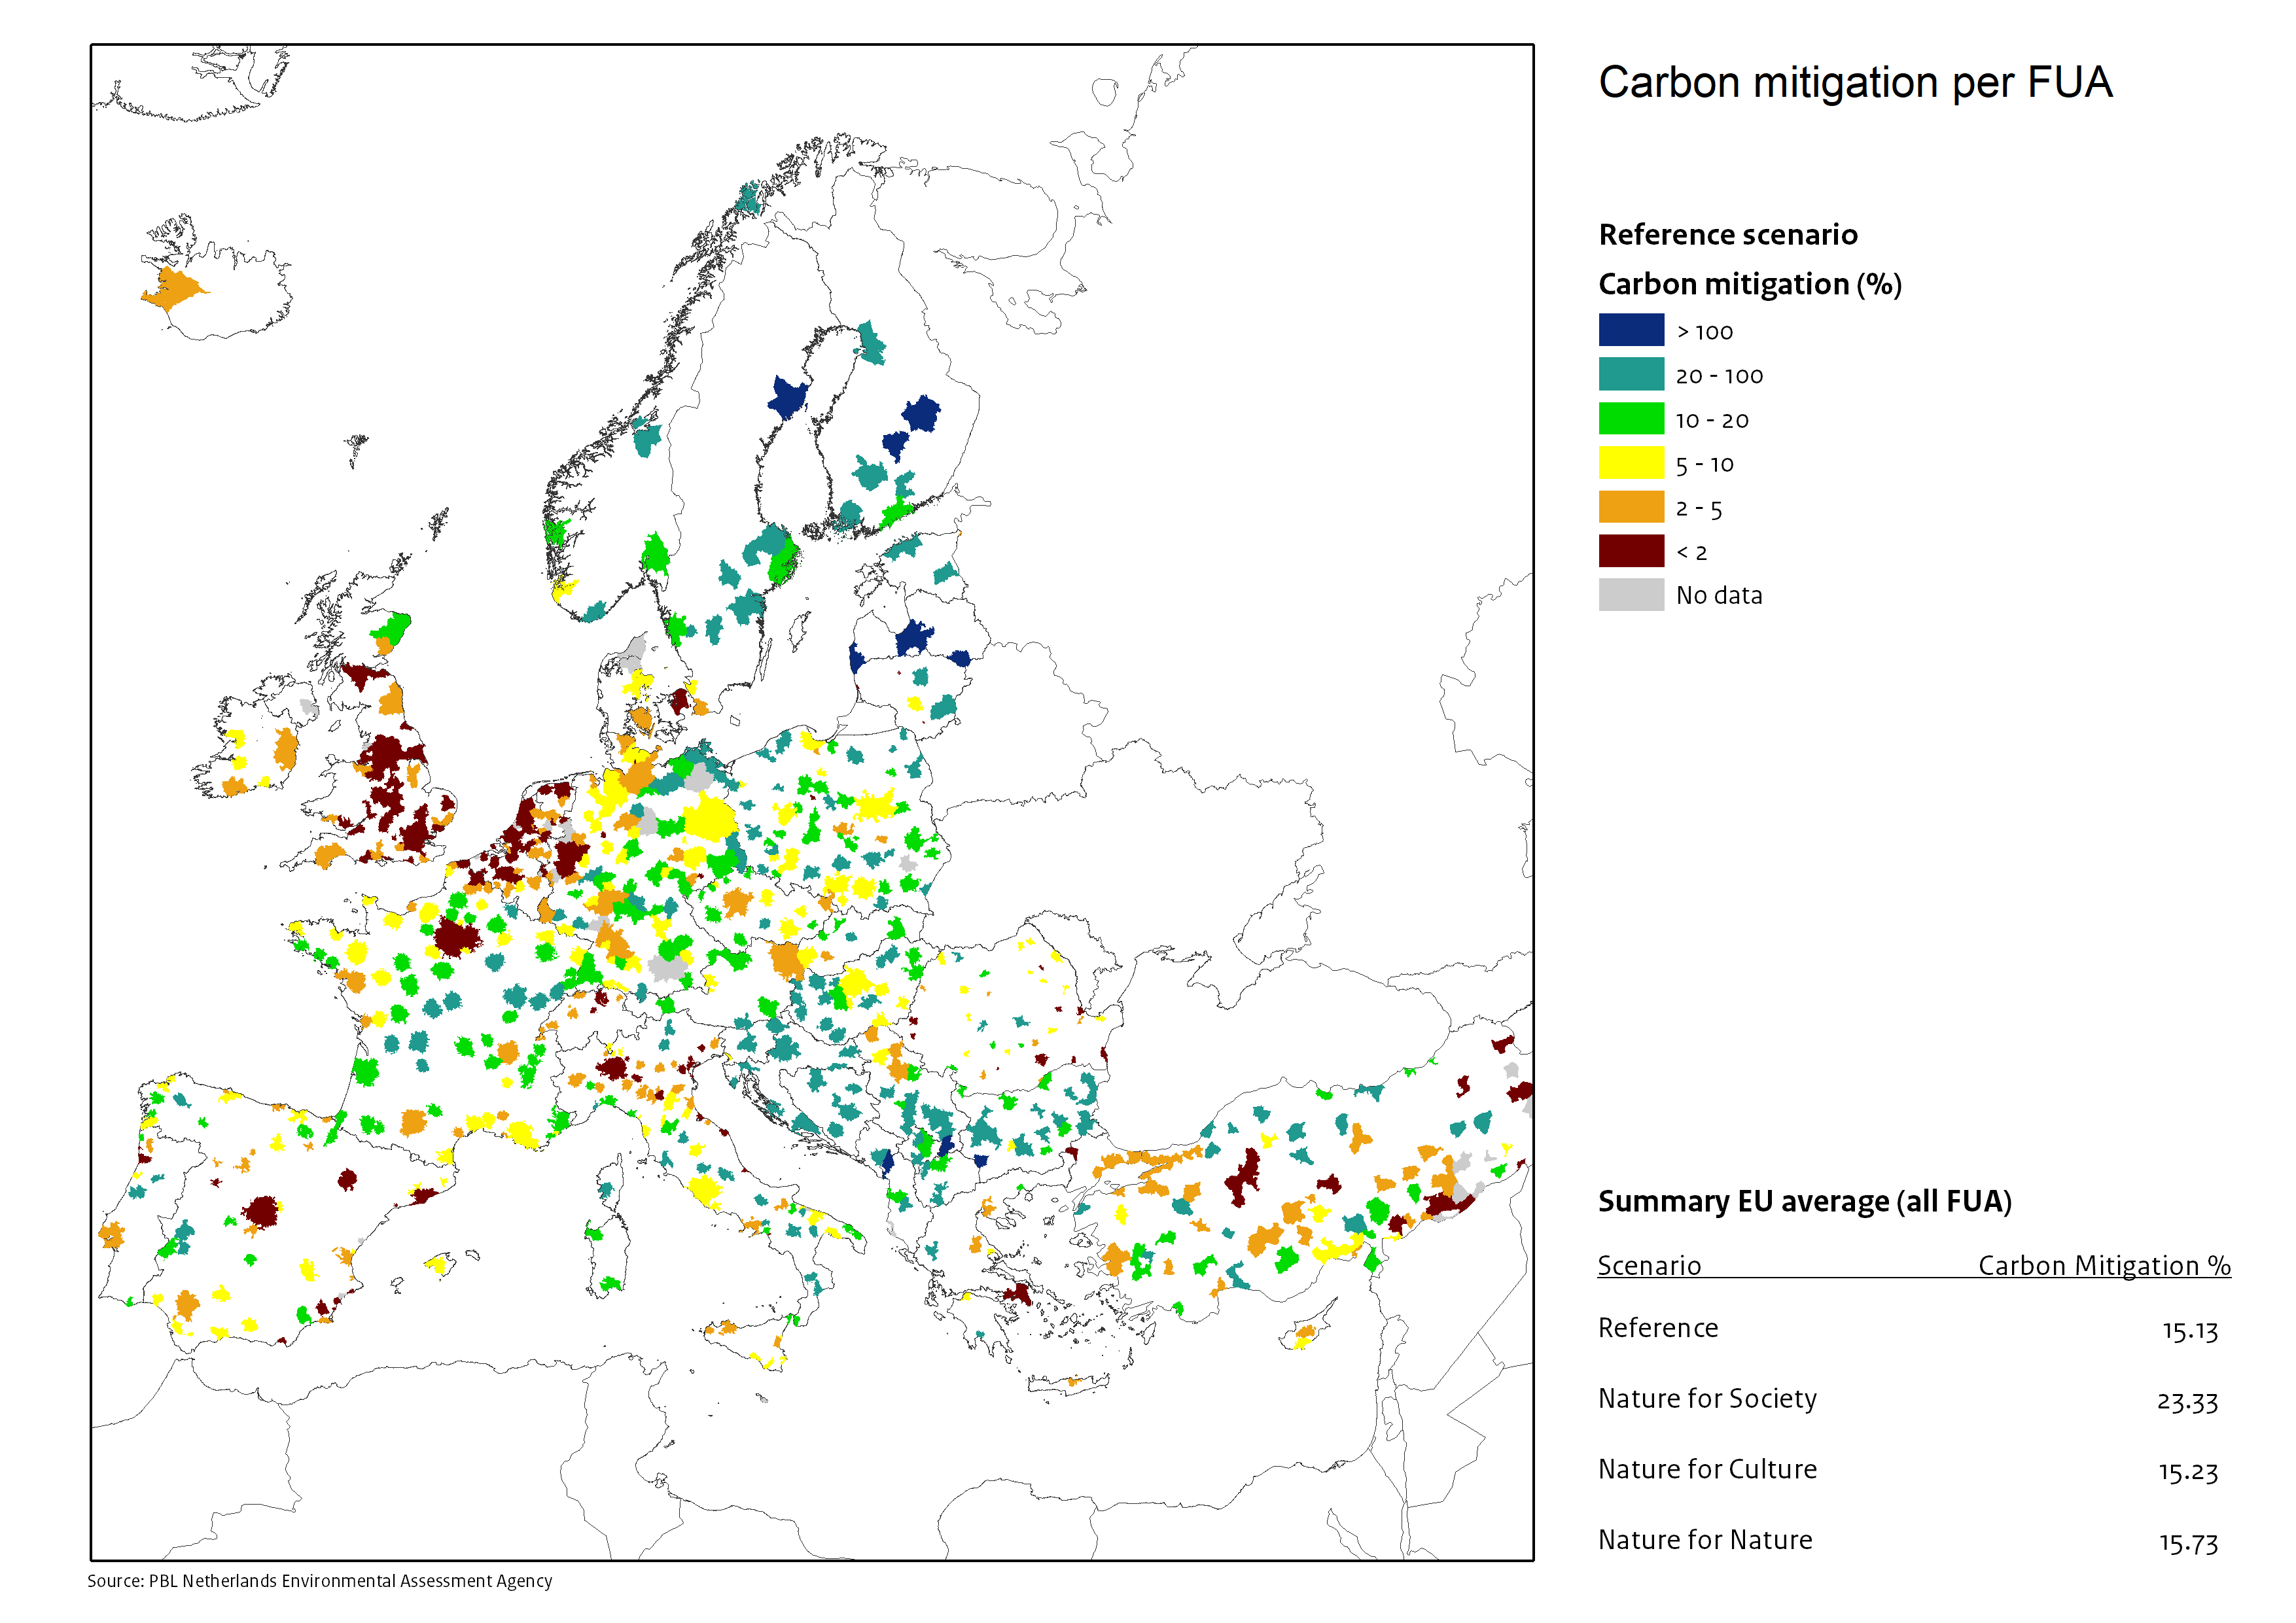
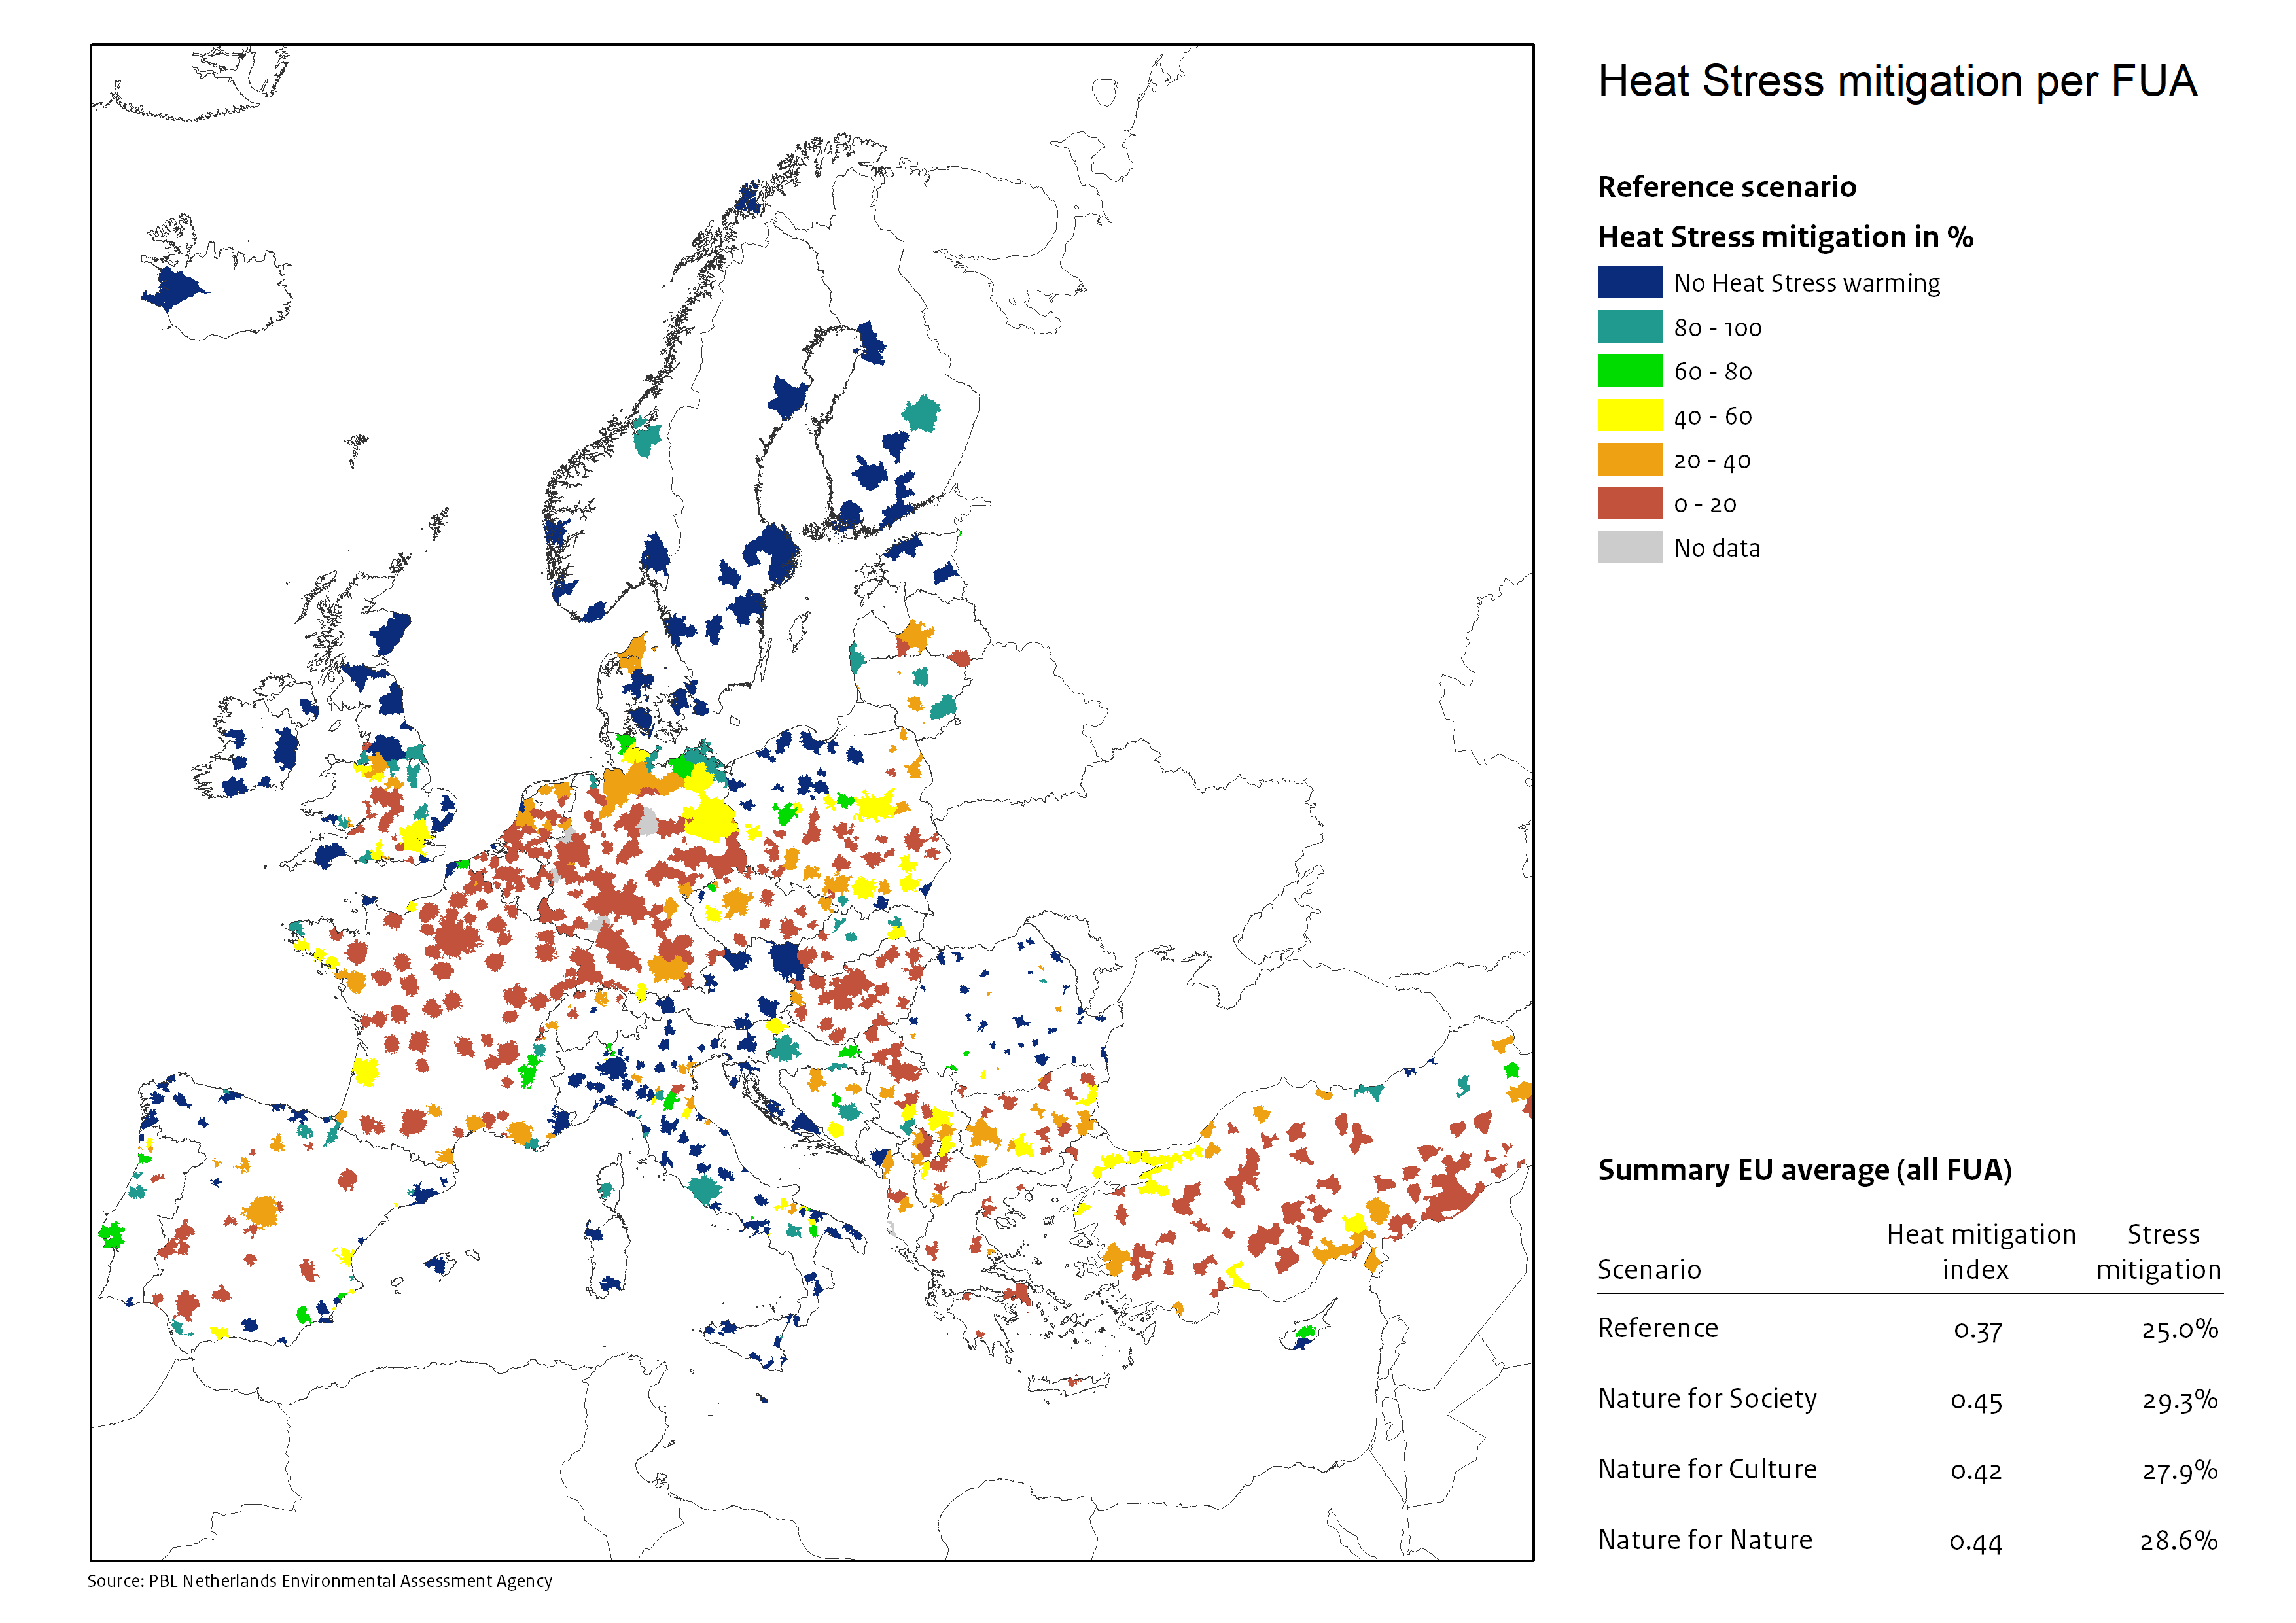
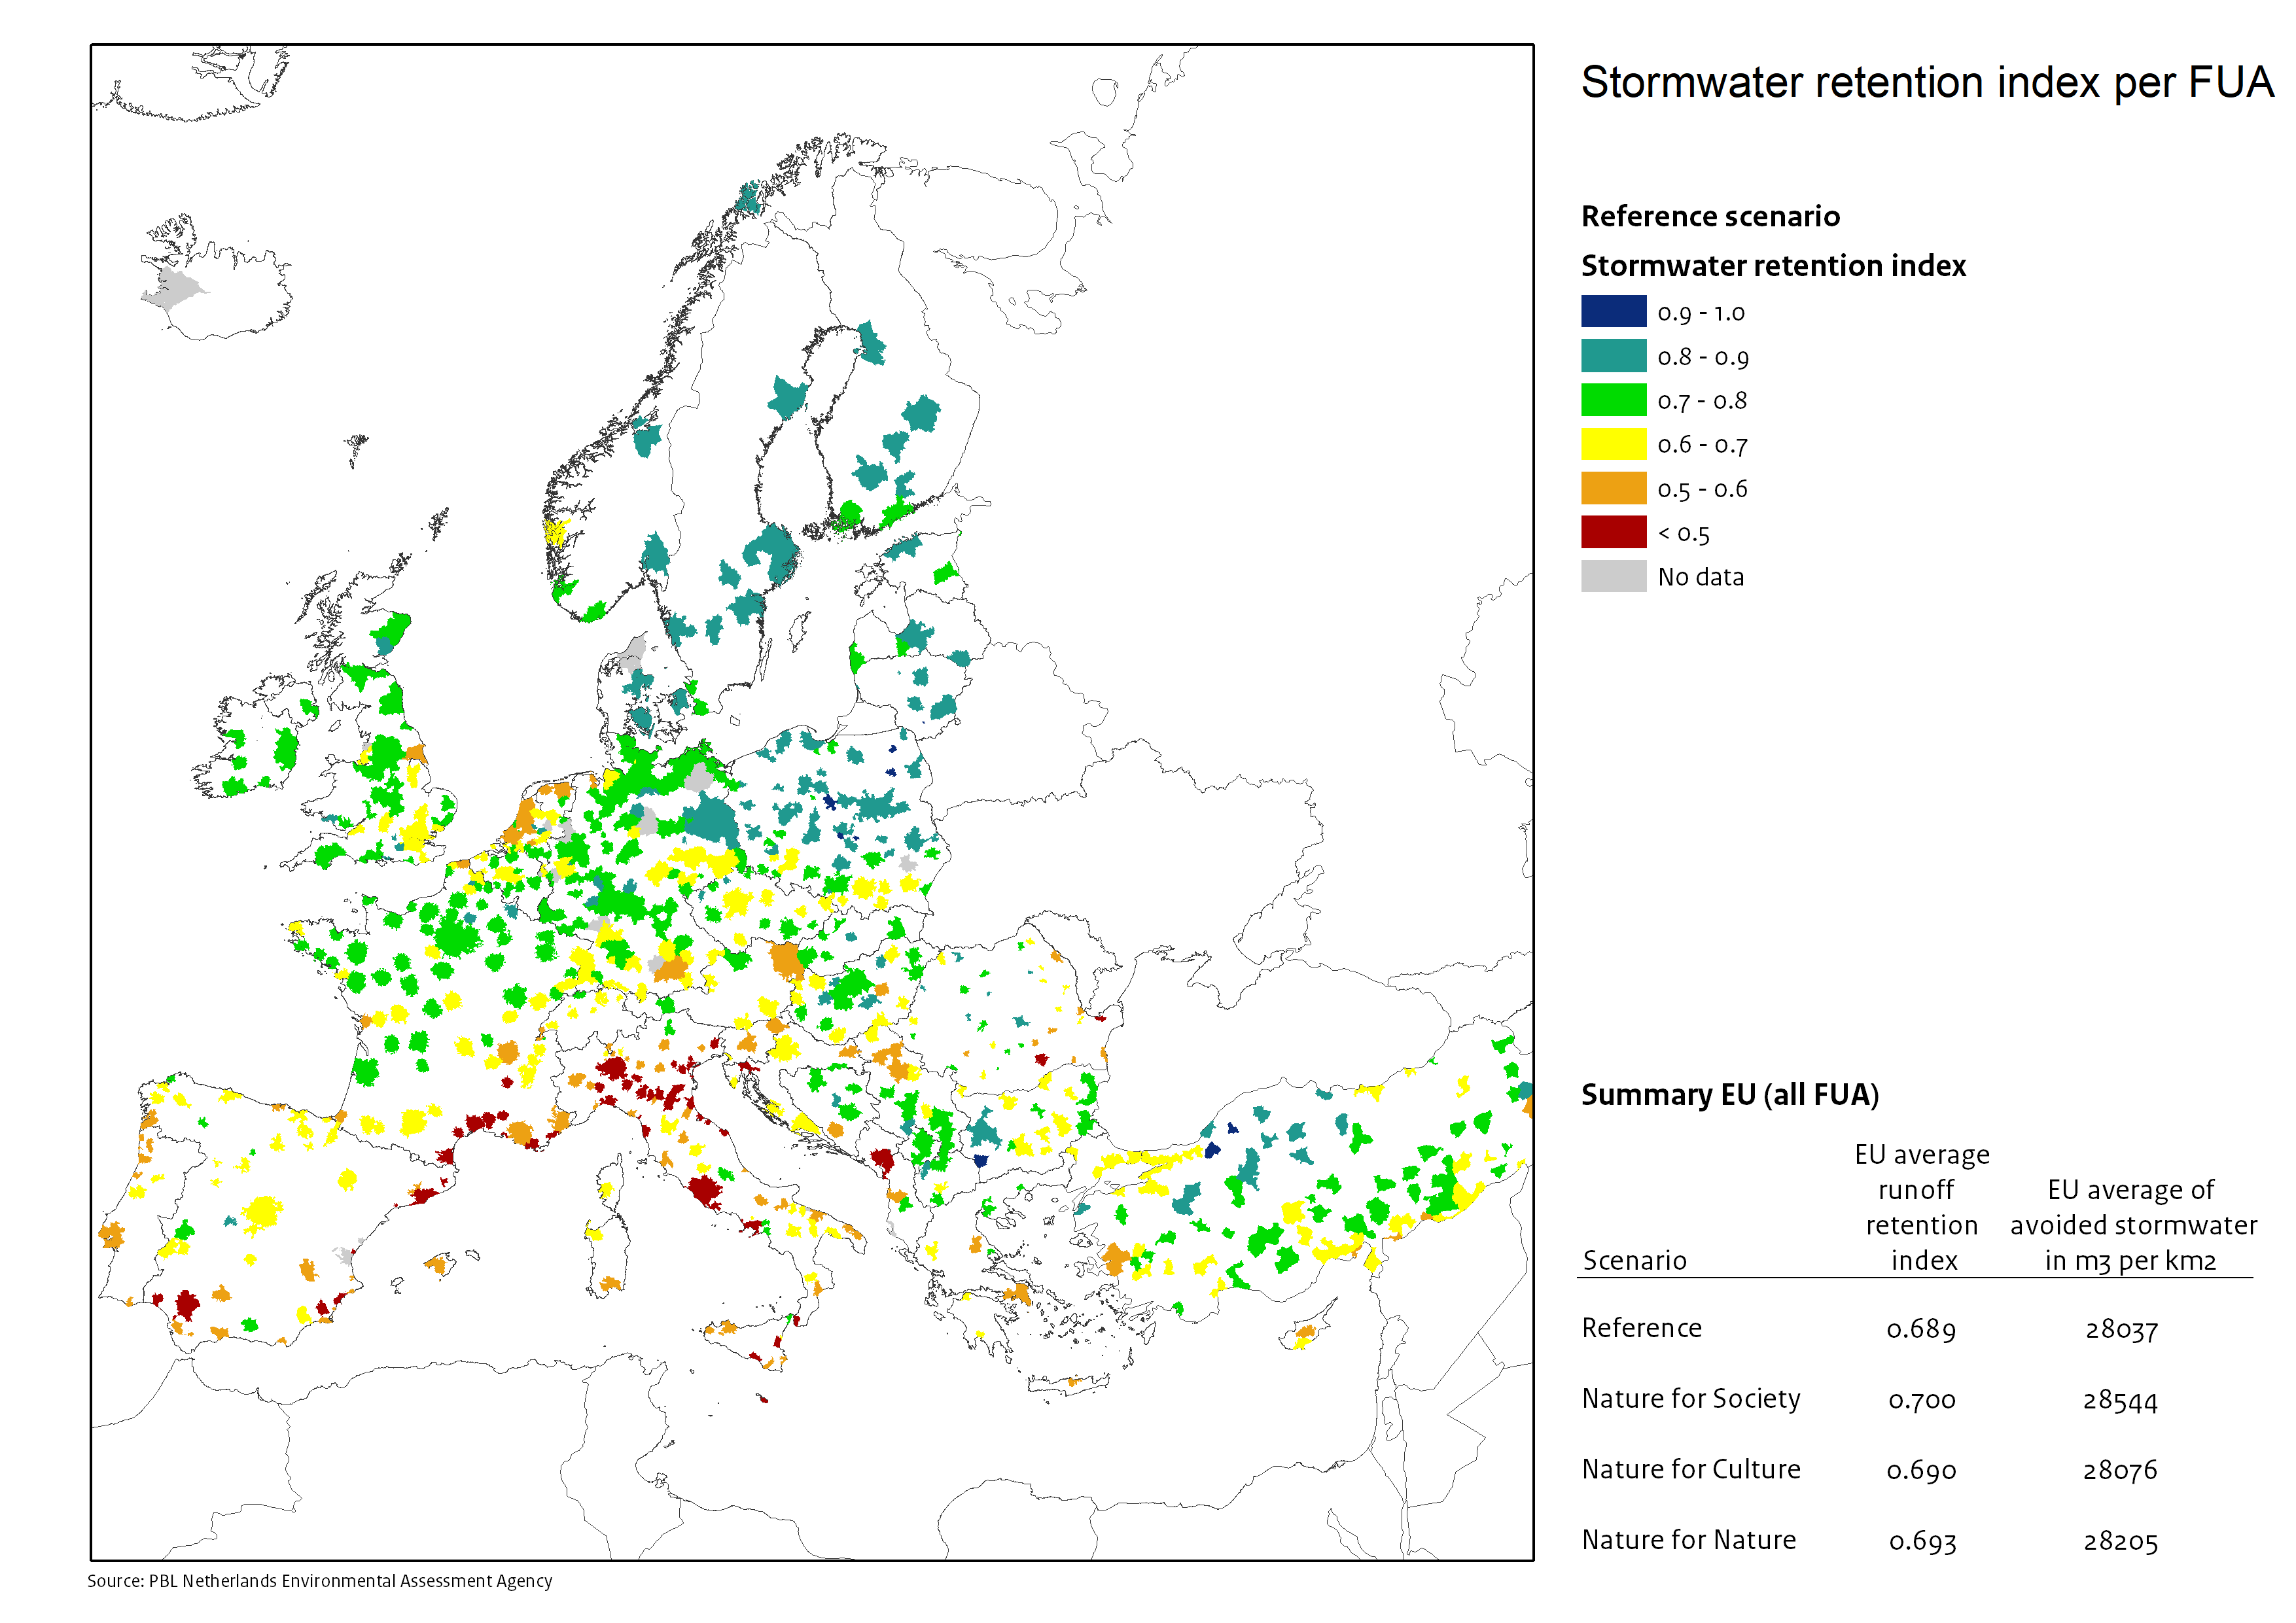
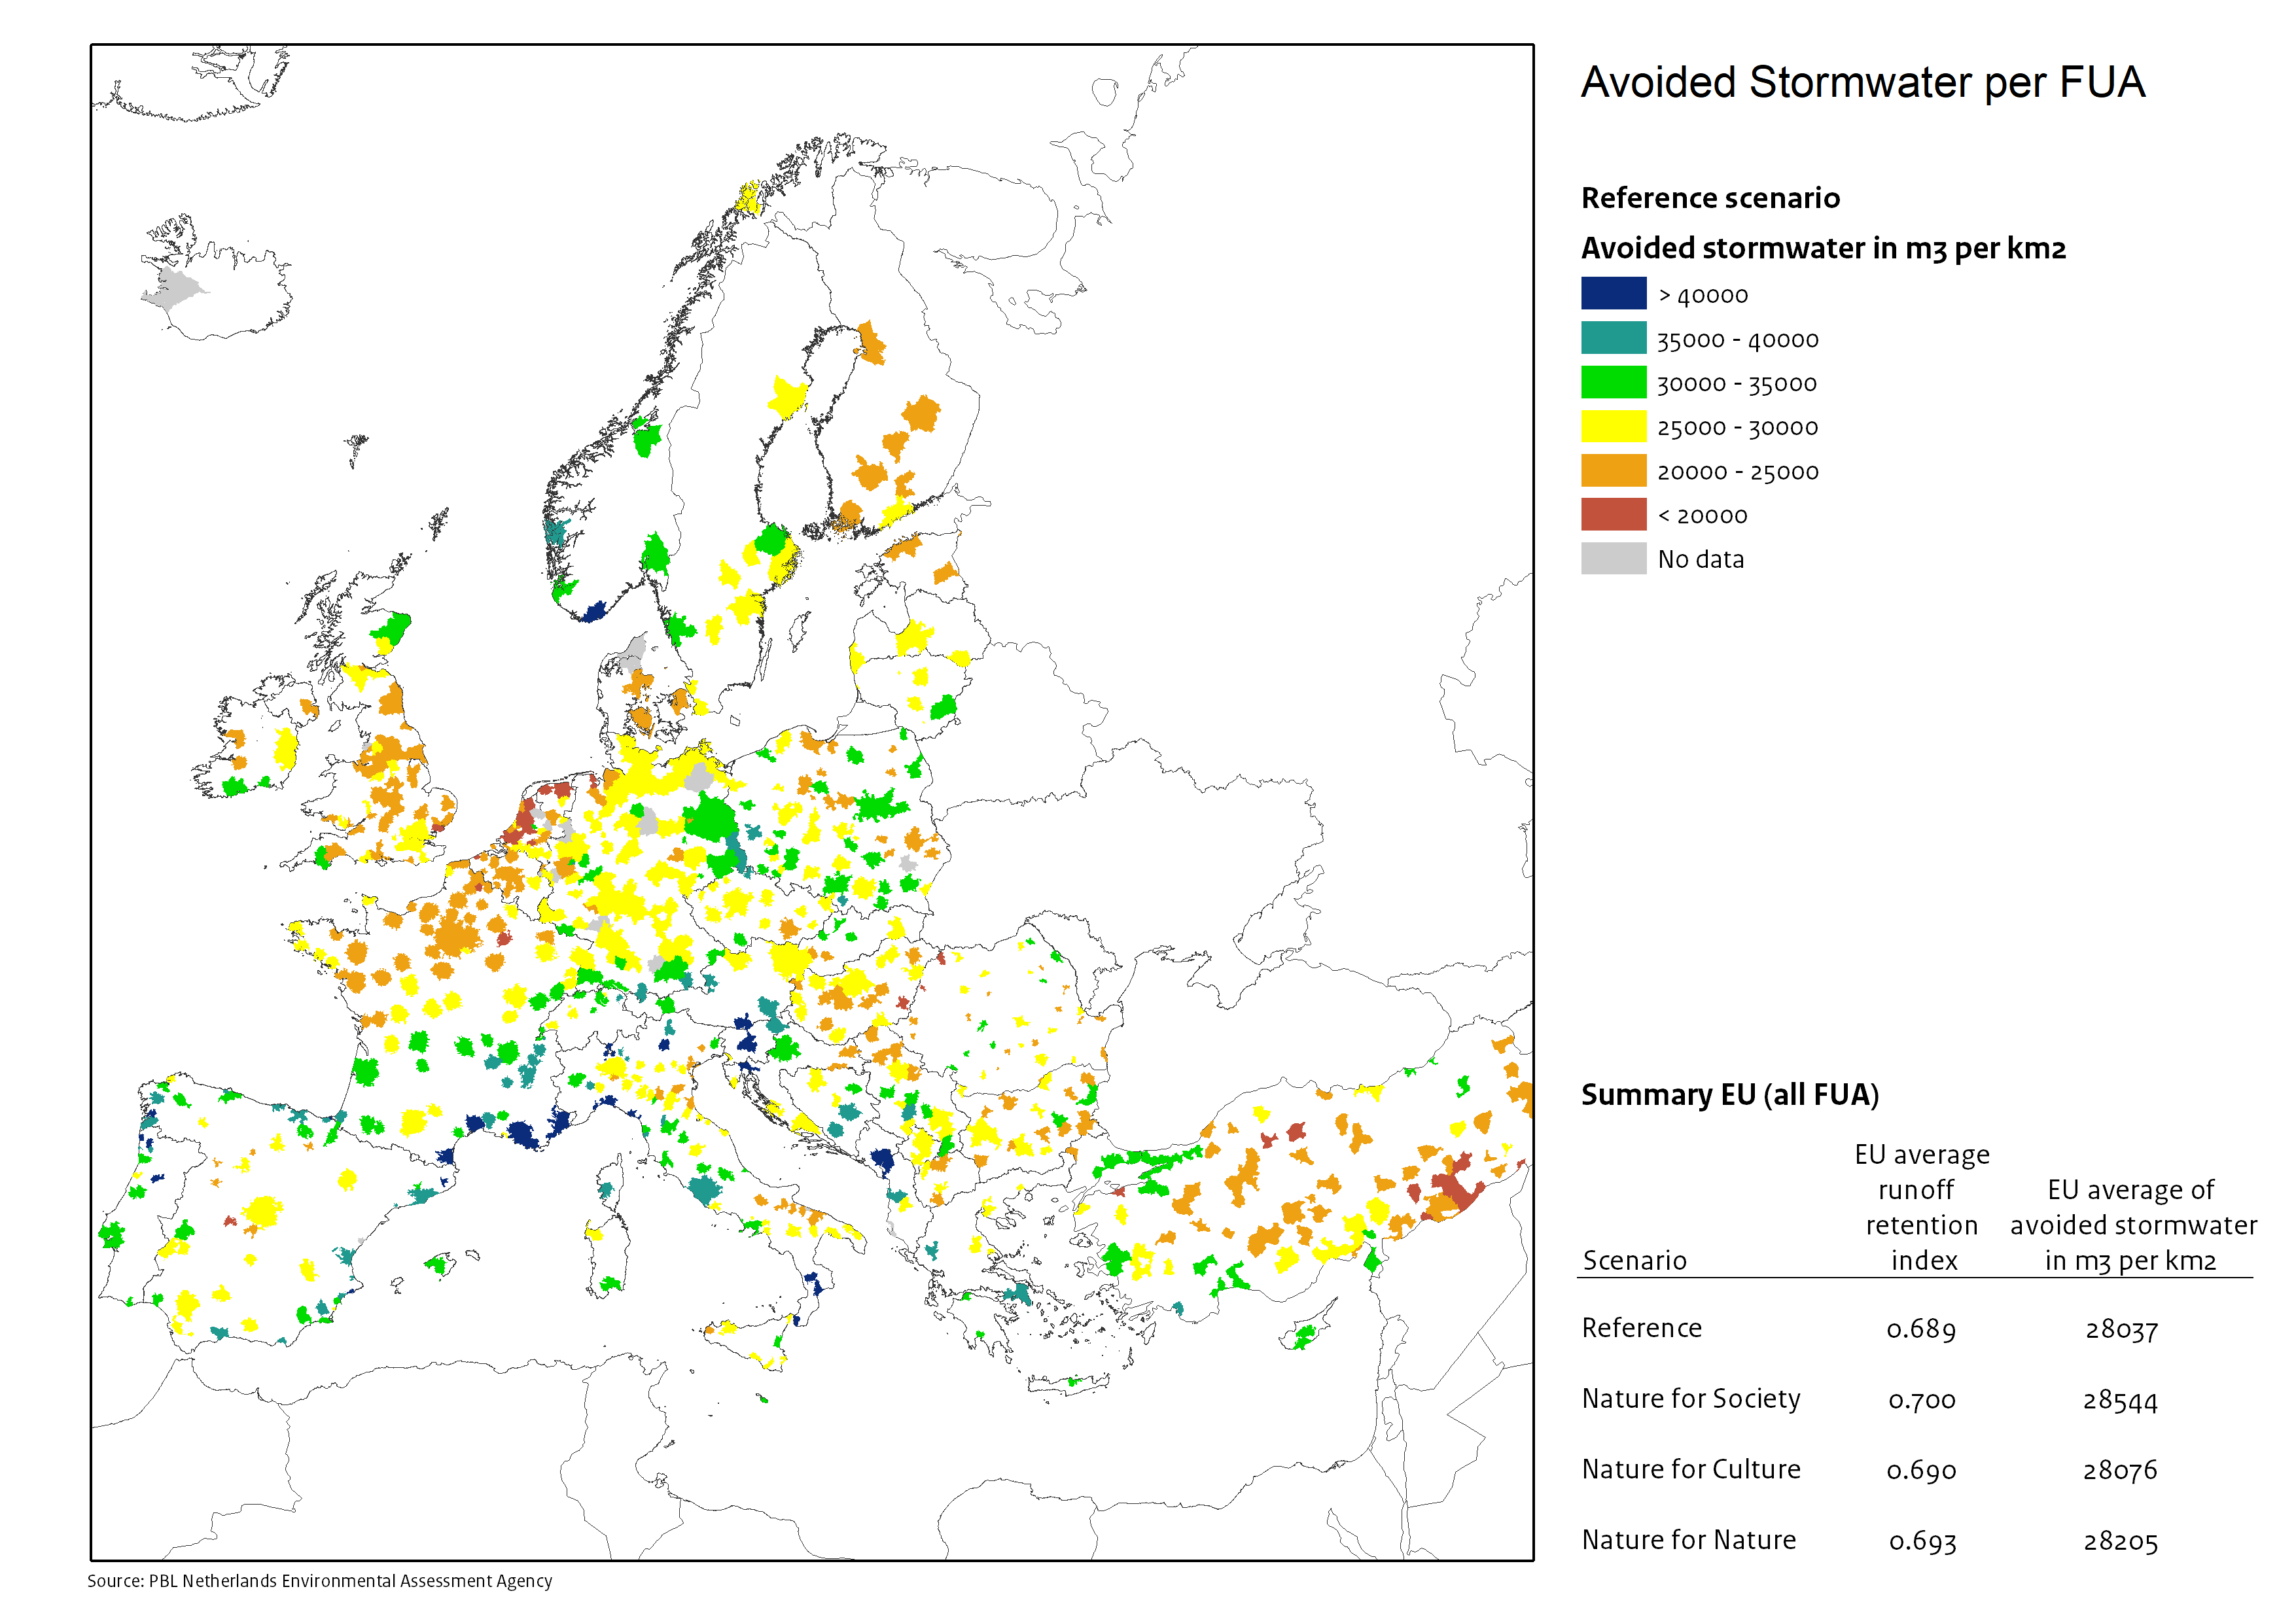
Reference: Current situation of existing nature-based solutions.
Green scenario: Implementing additional trees, parks and forests.
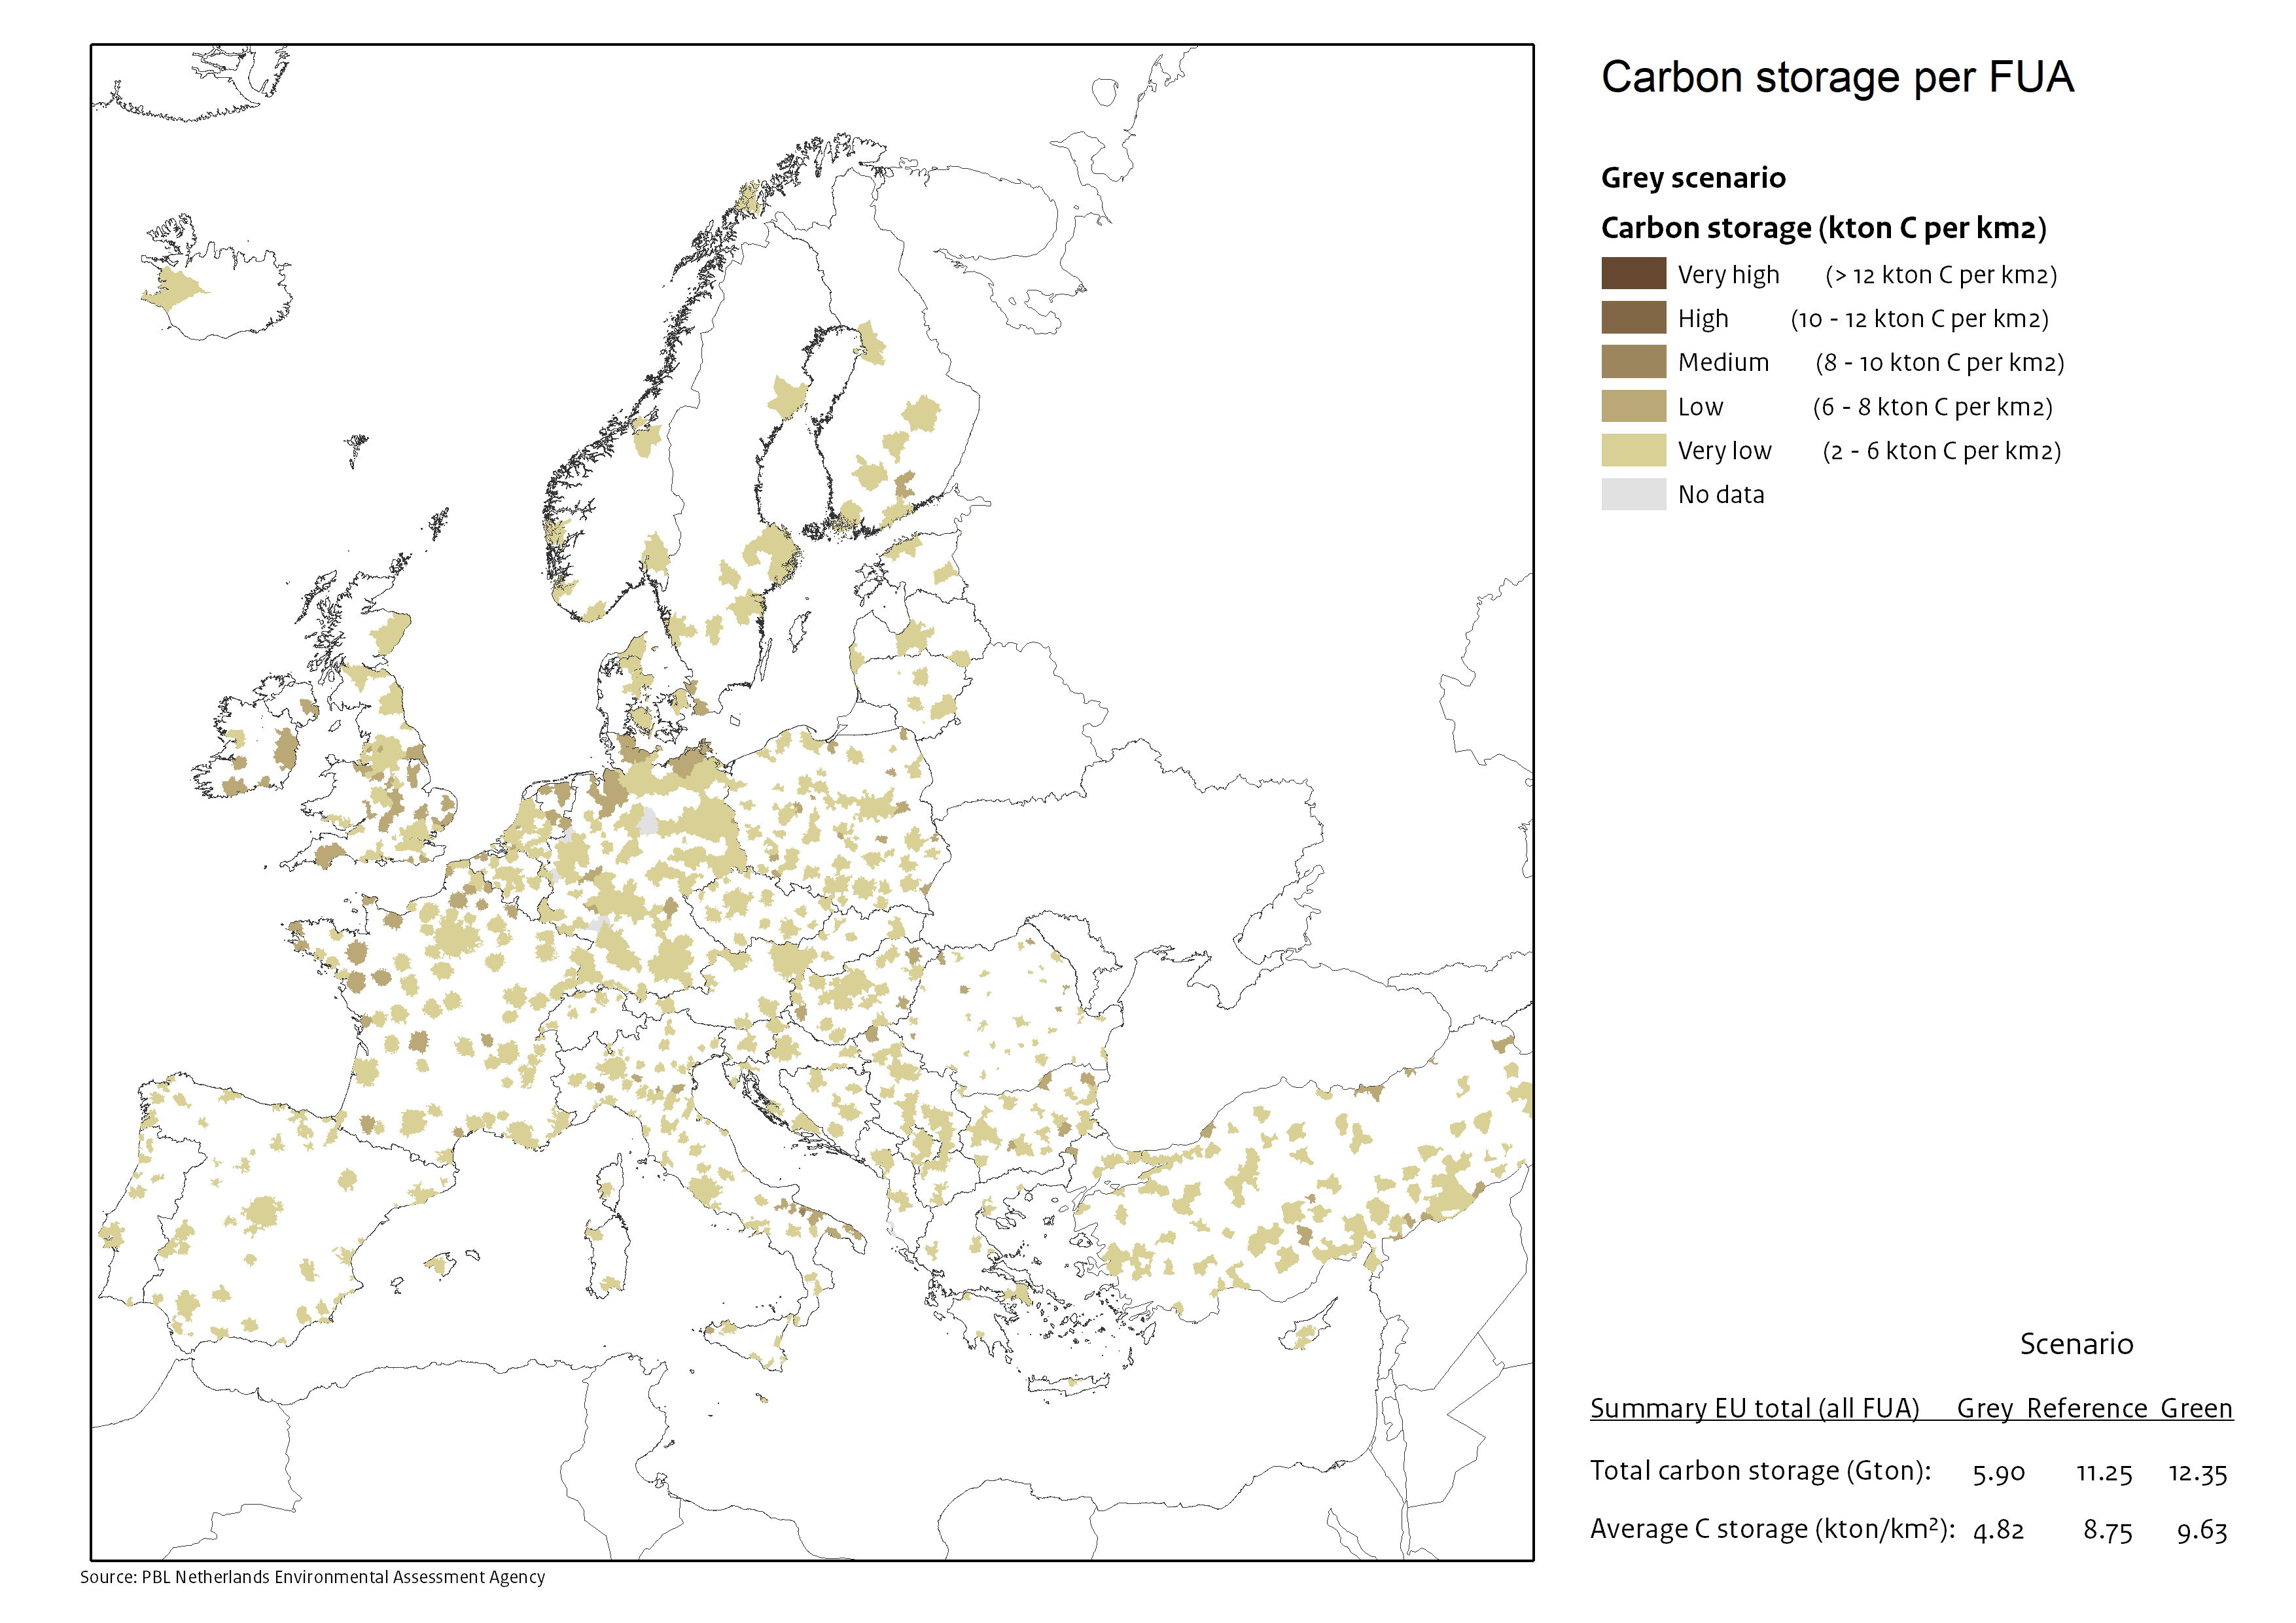
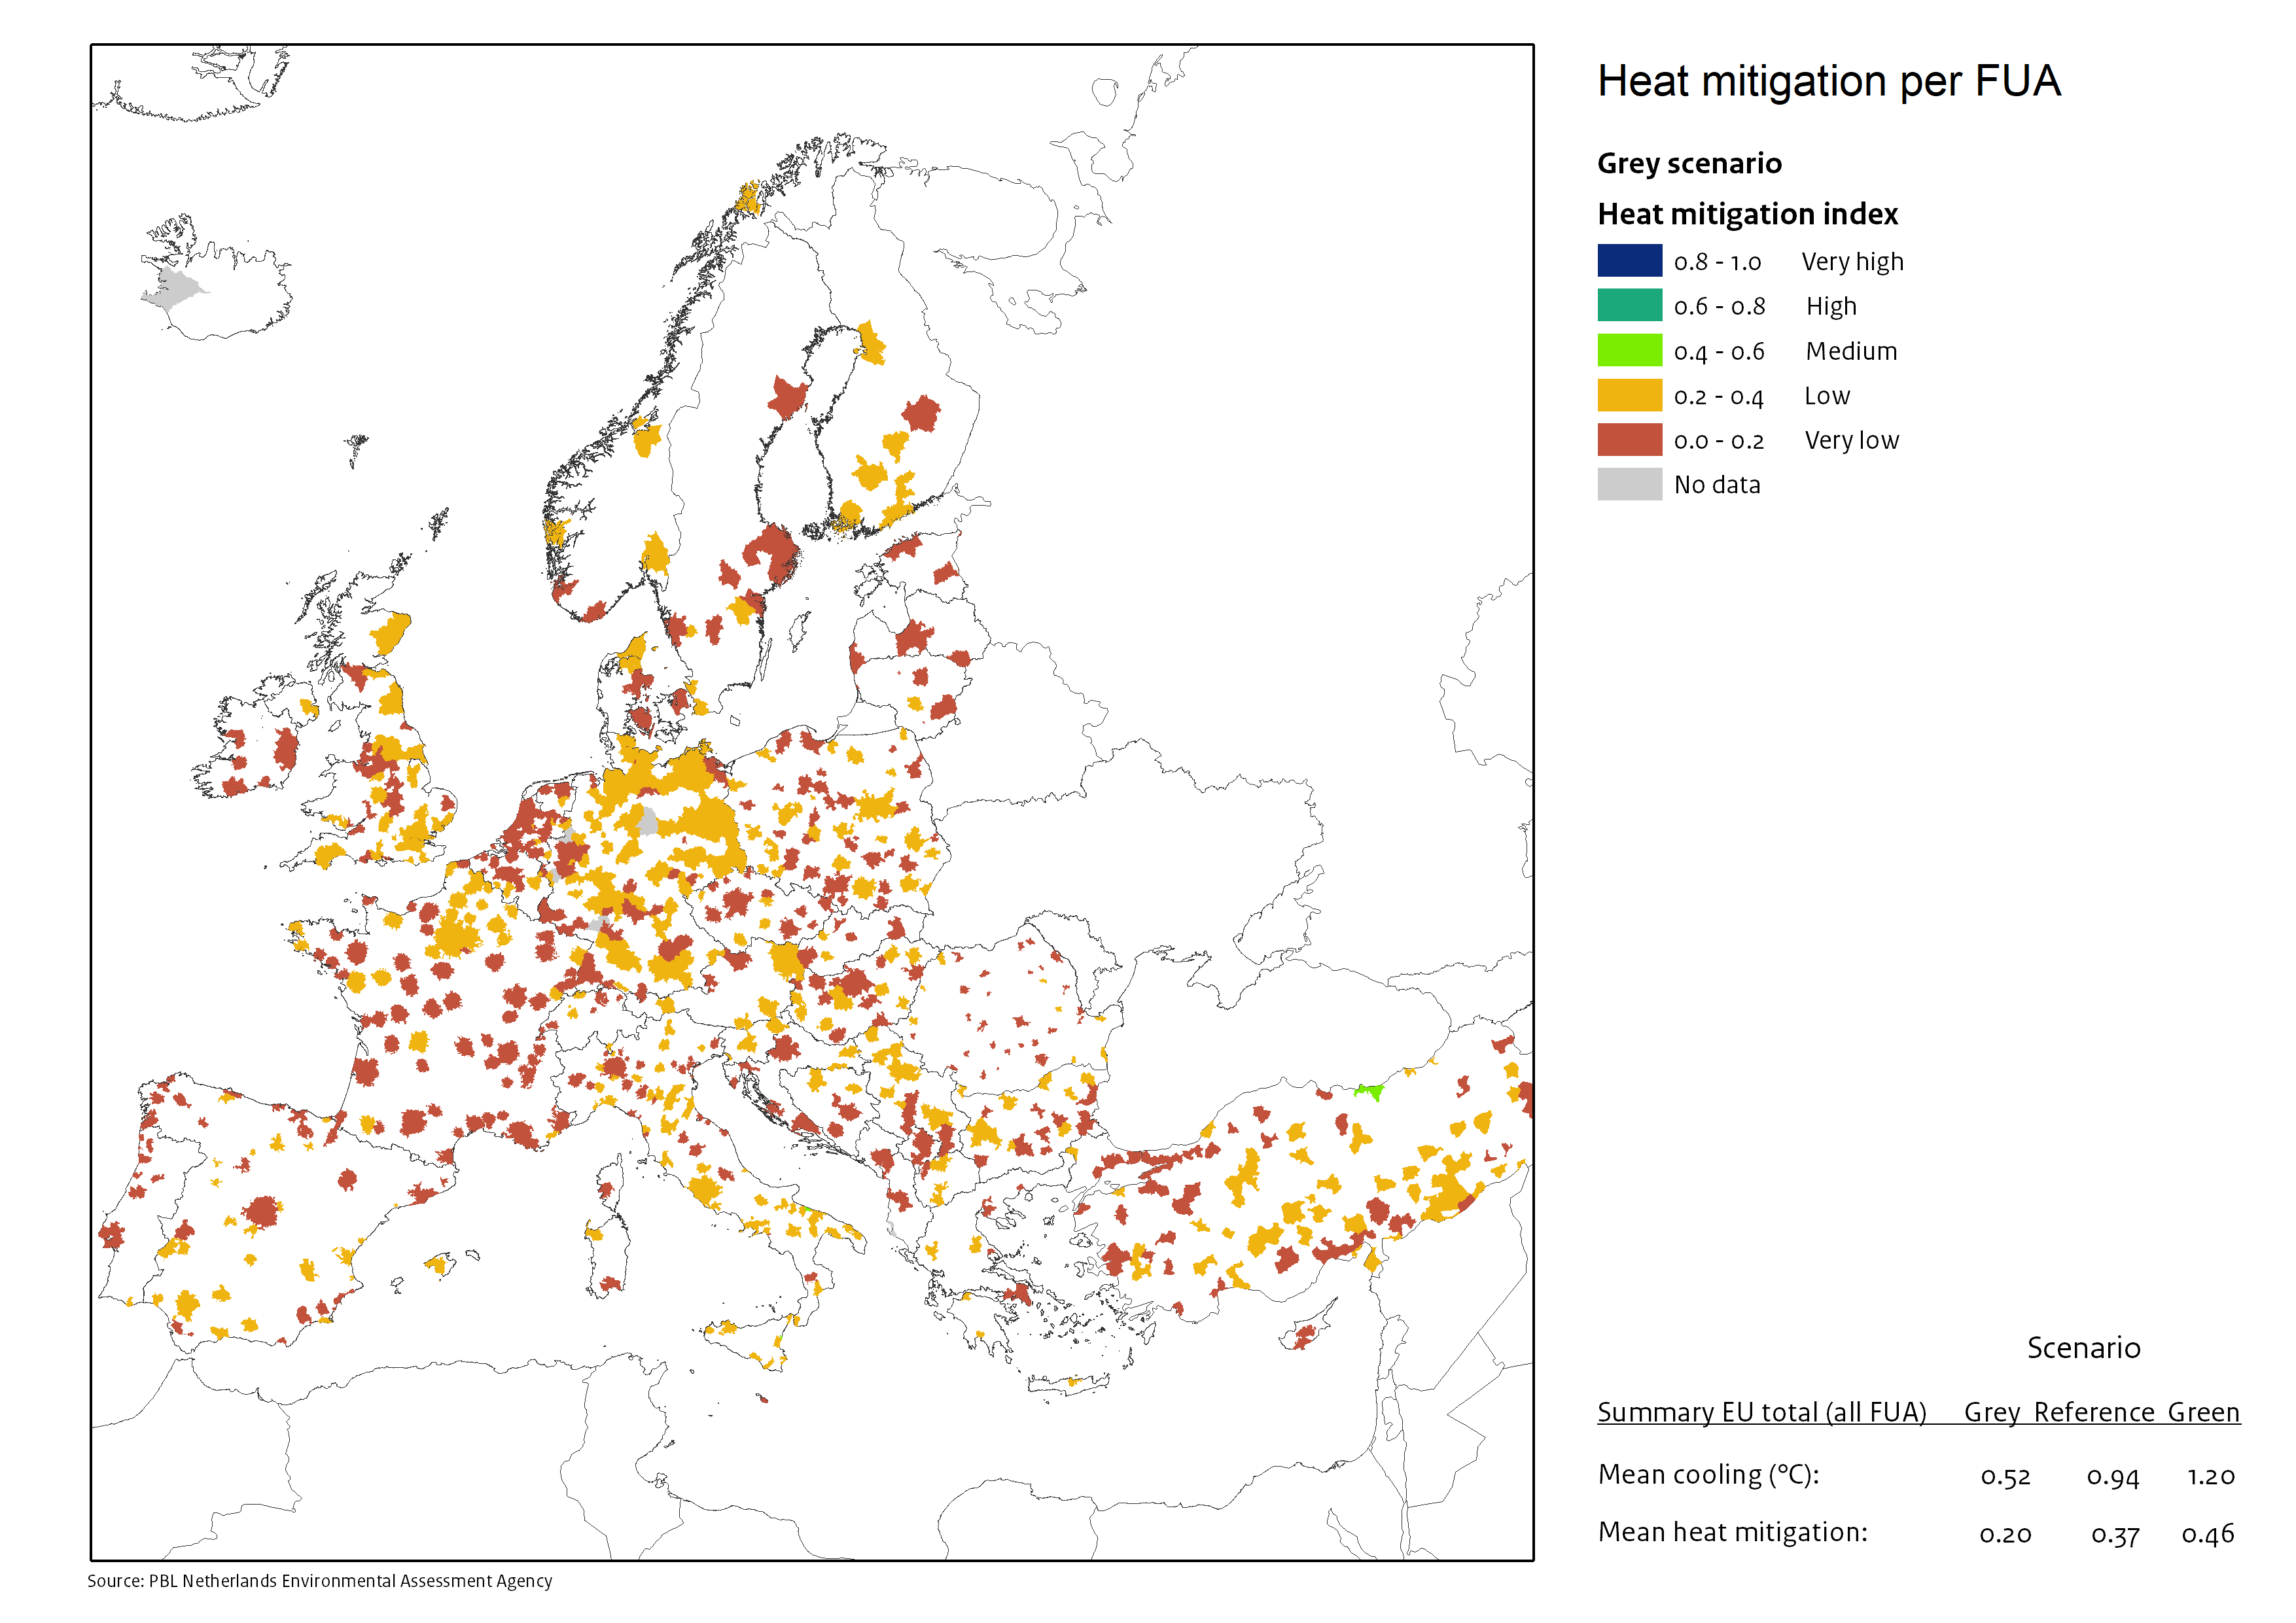
Grey scenario: Largely removing trees, parks and forests.
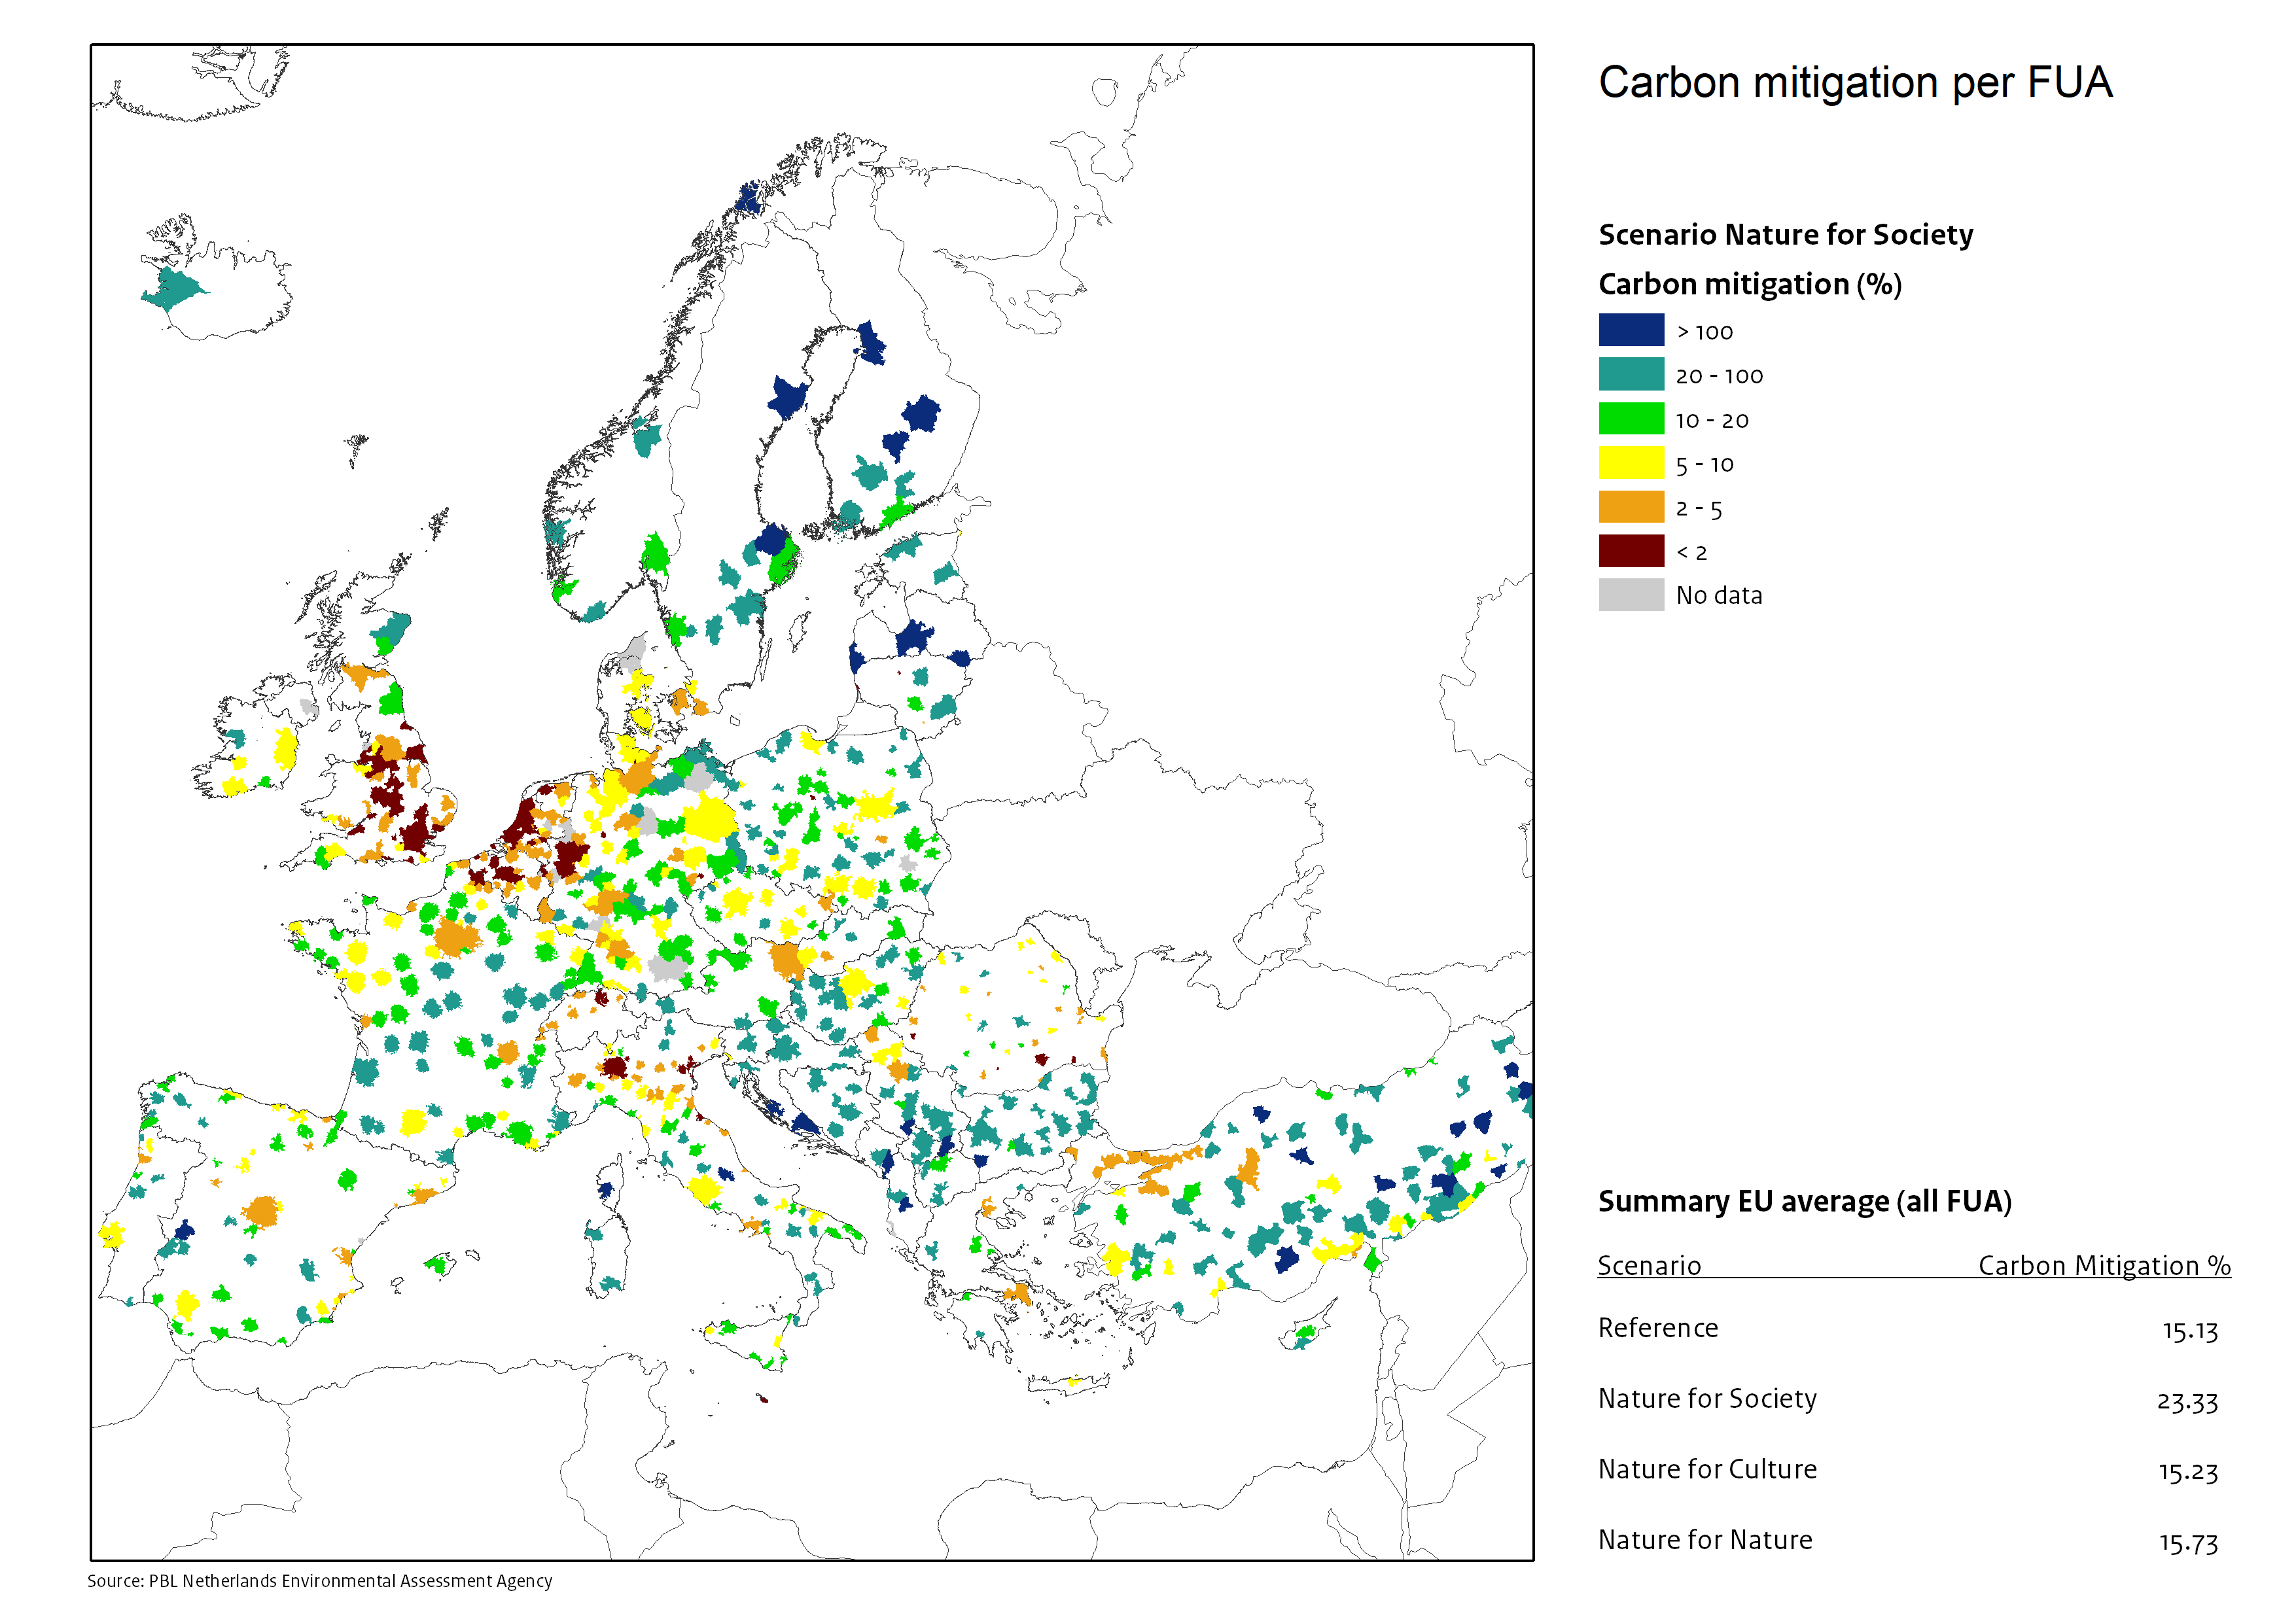
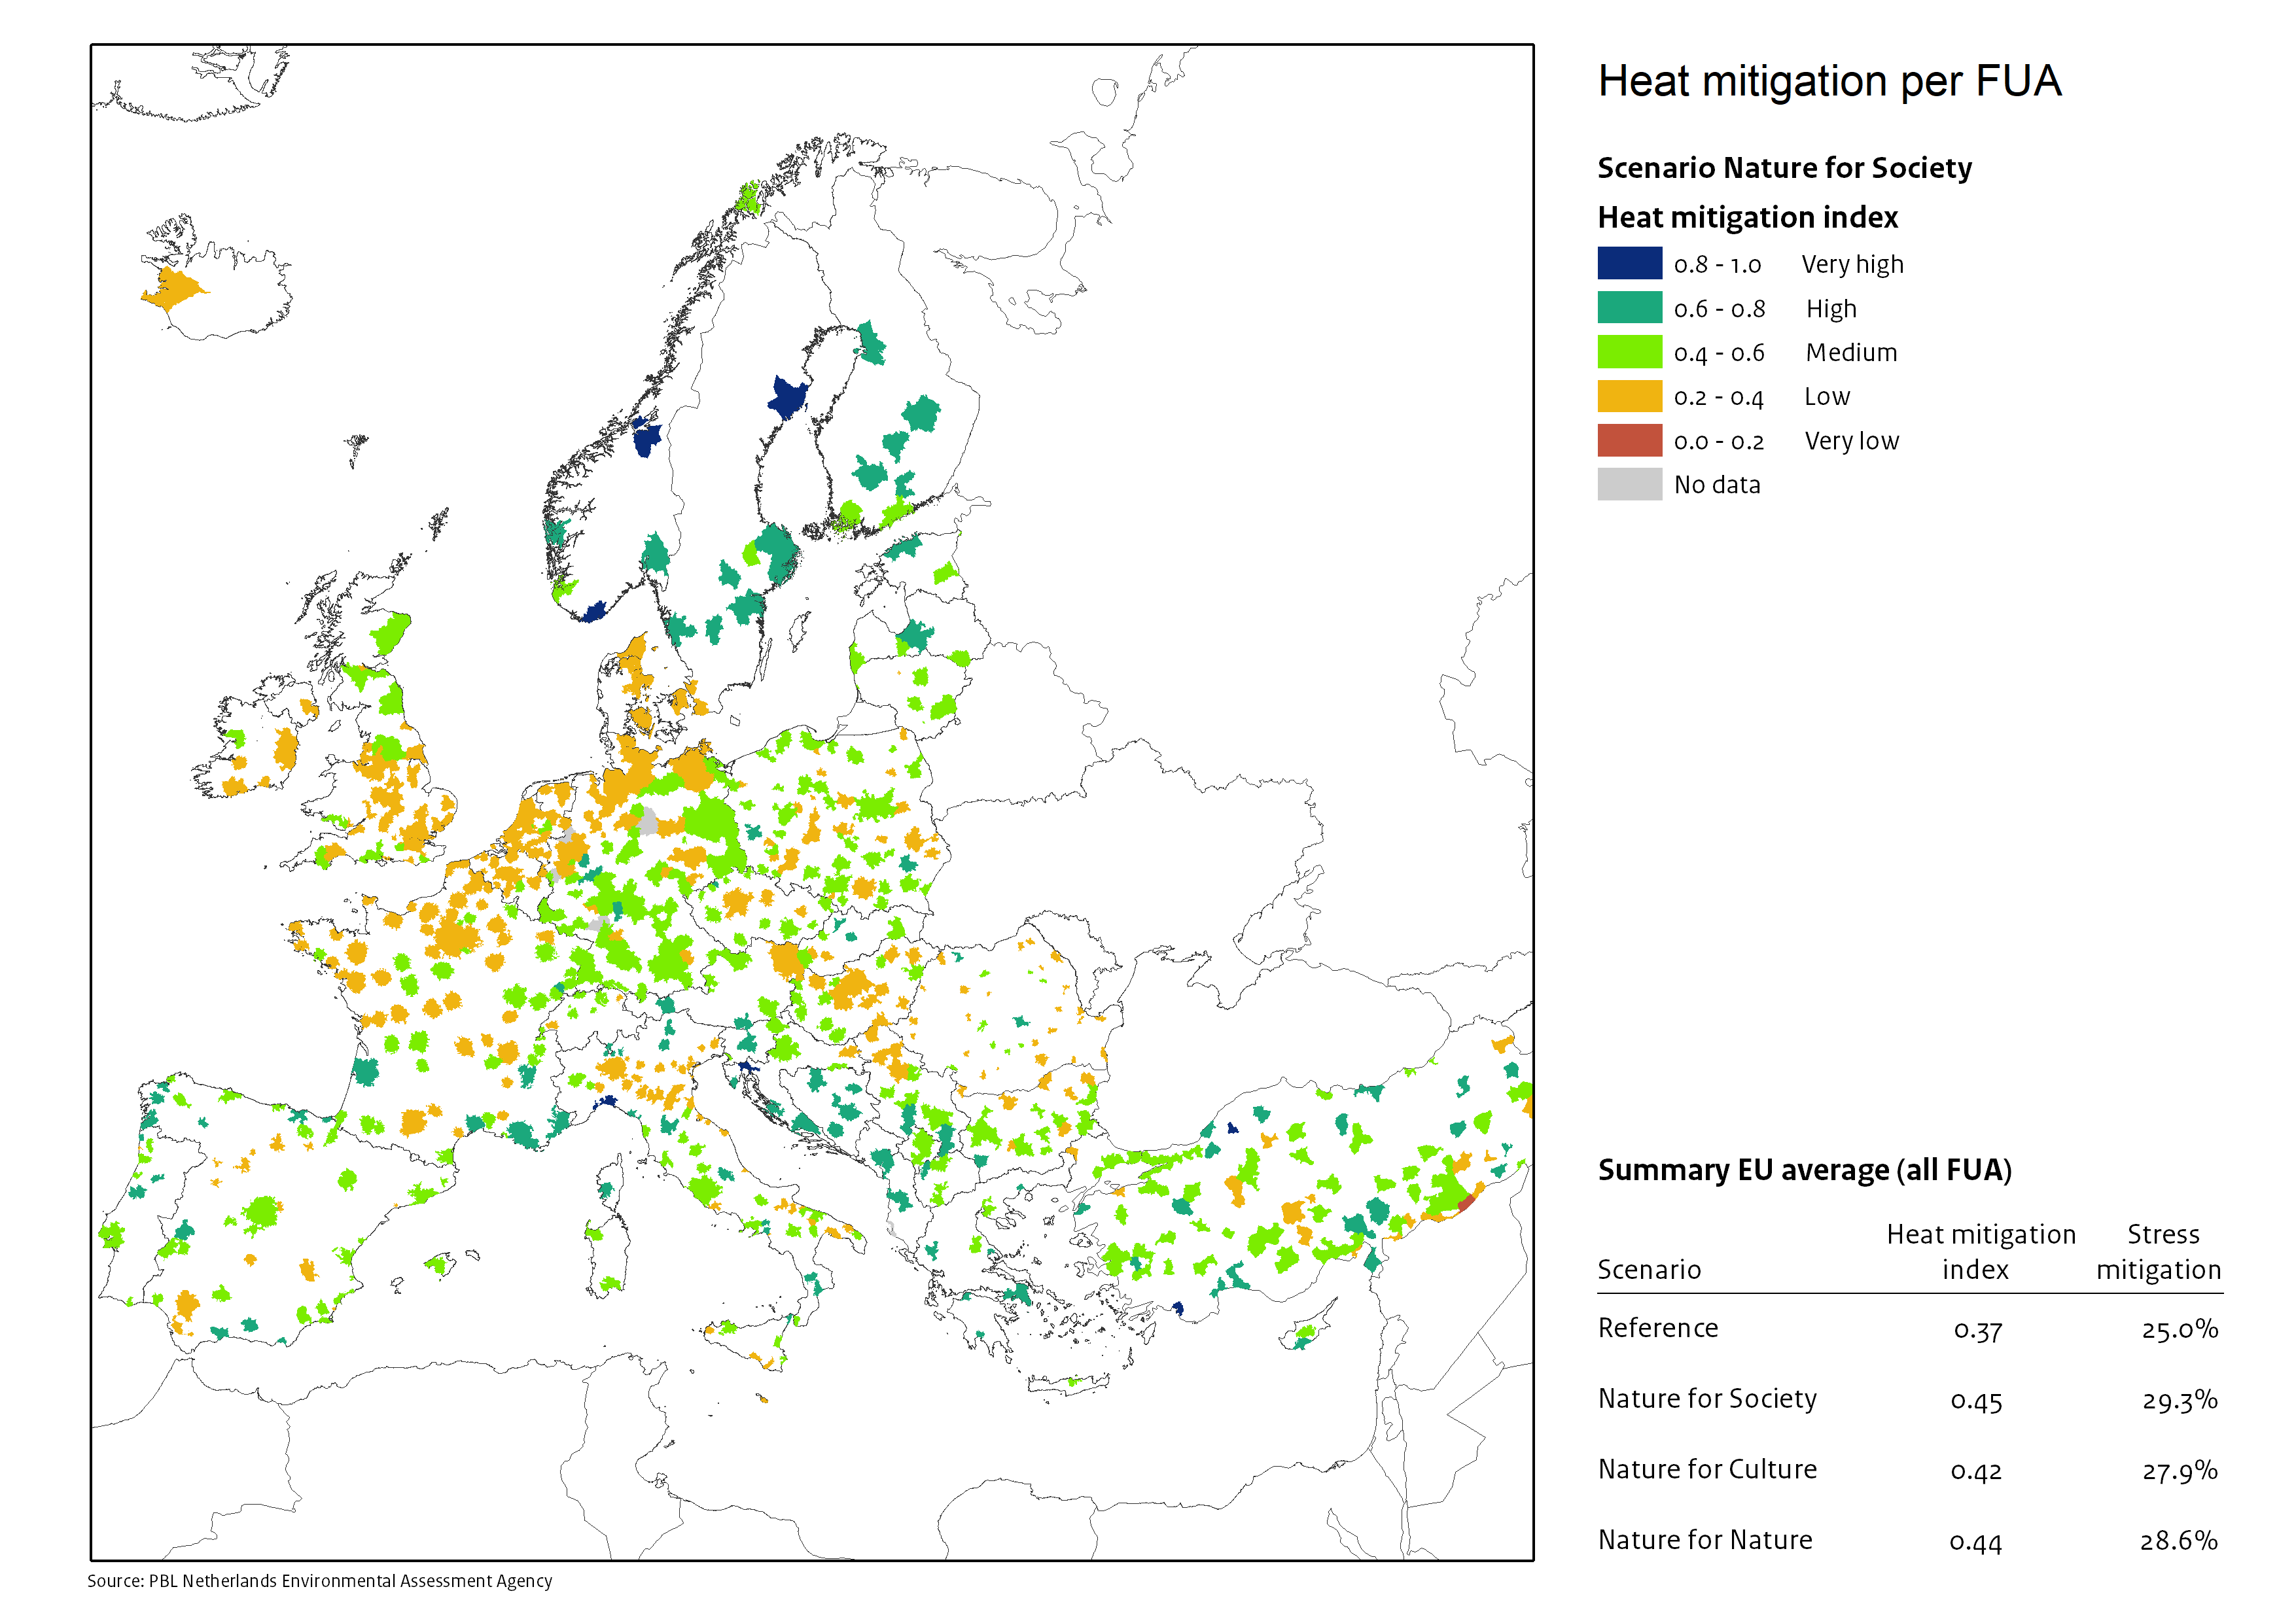
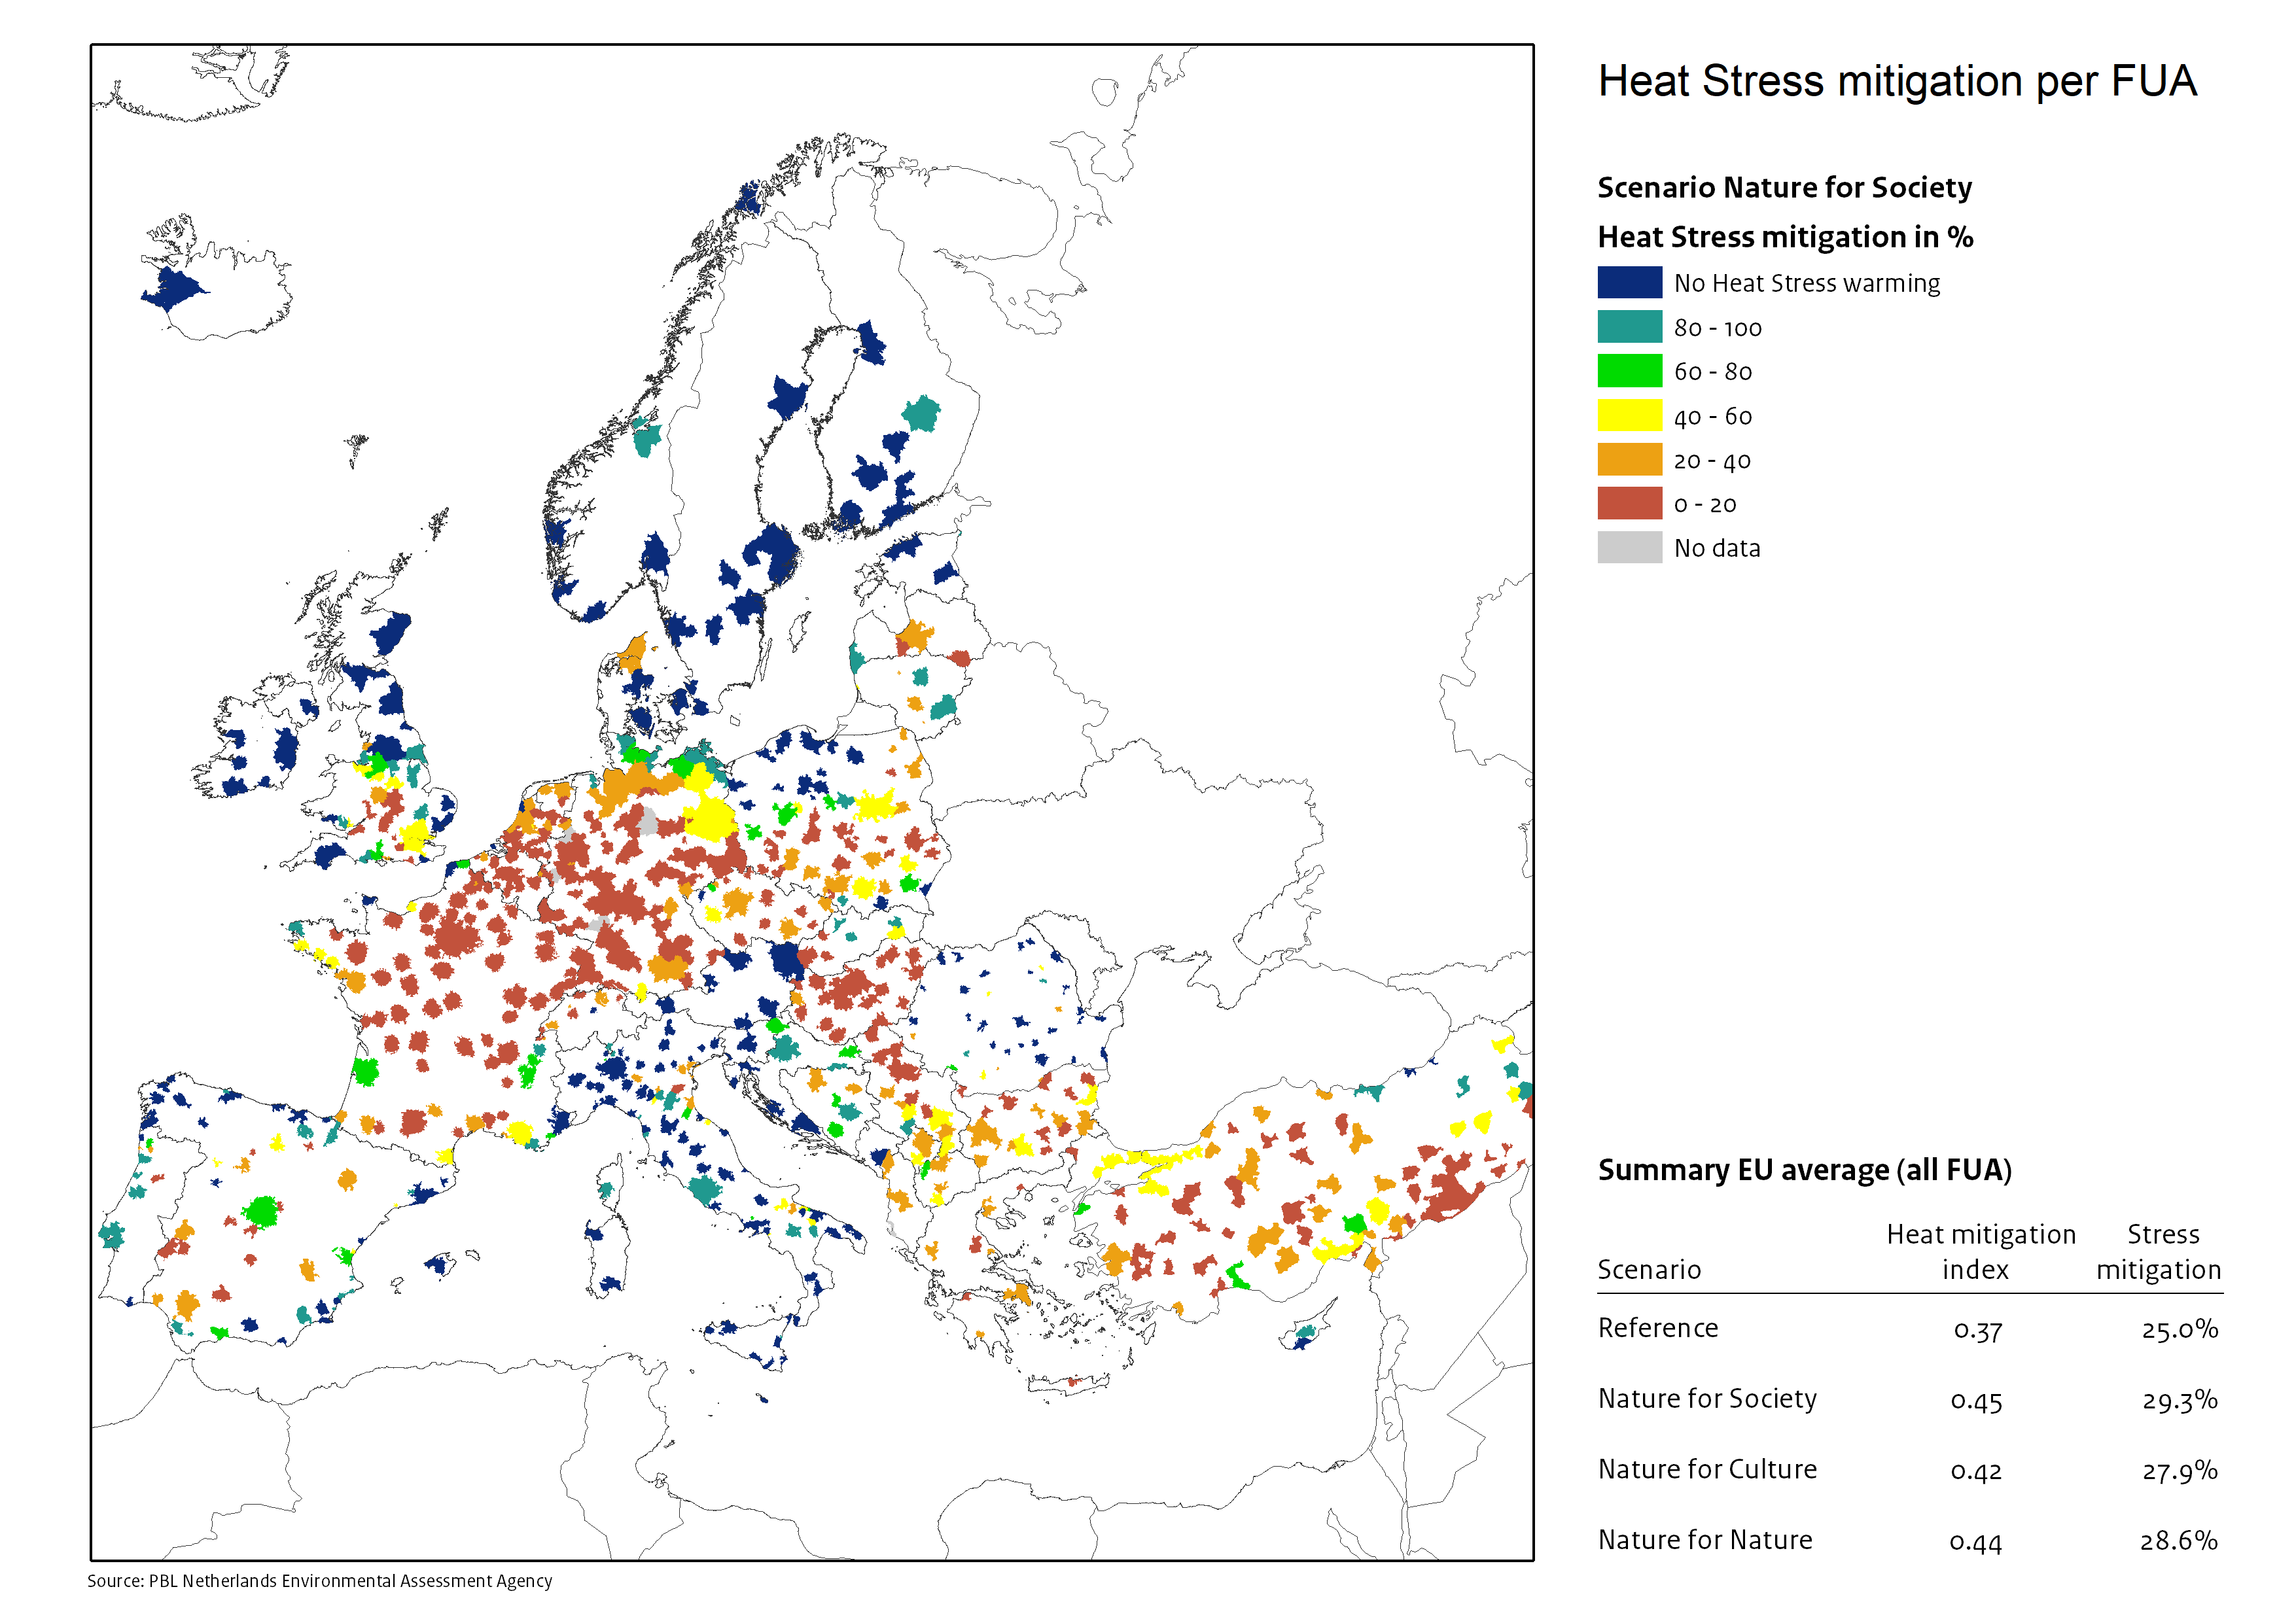
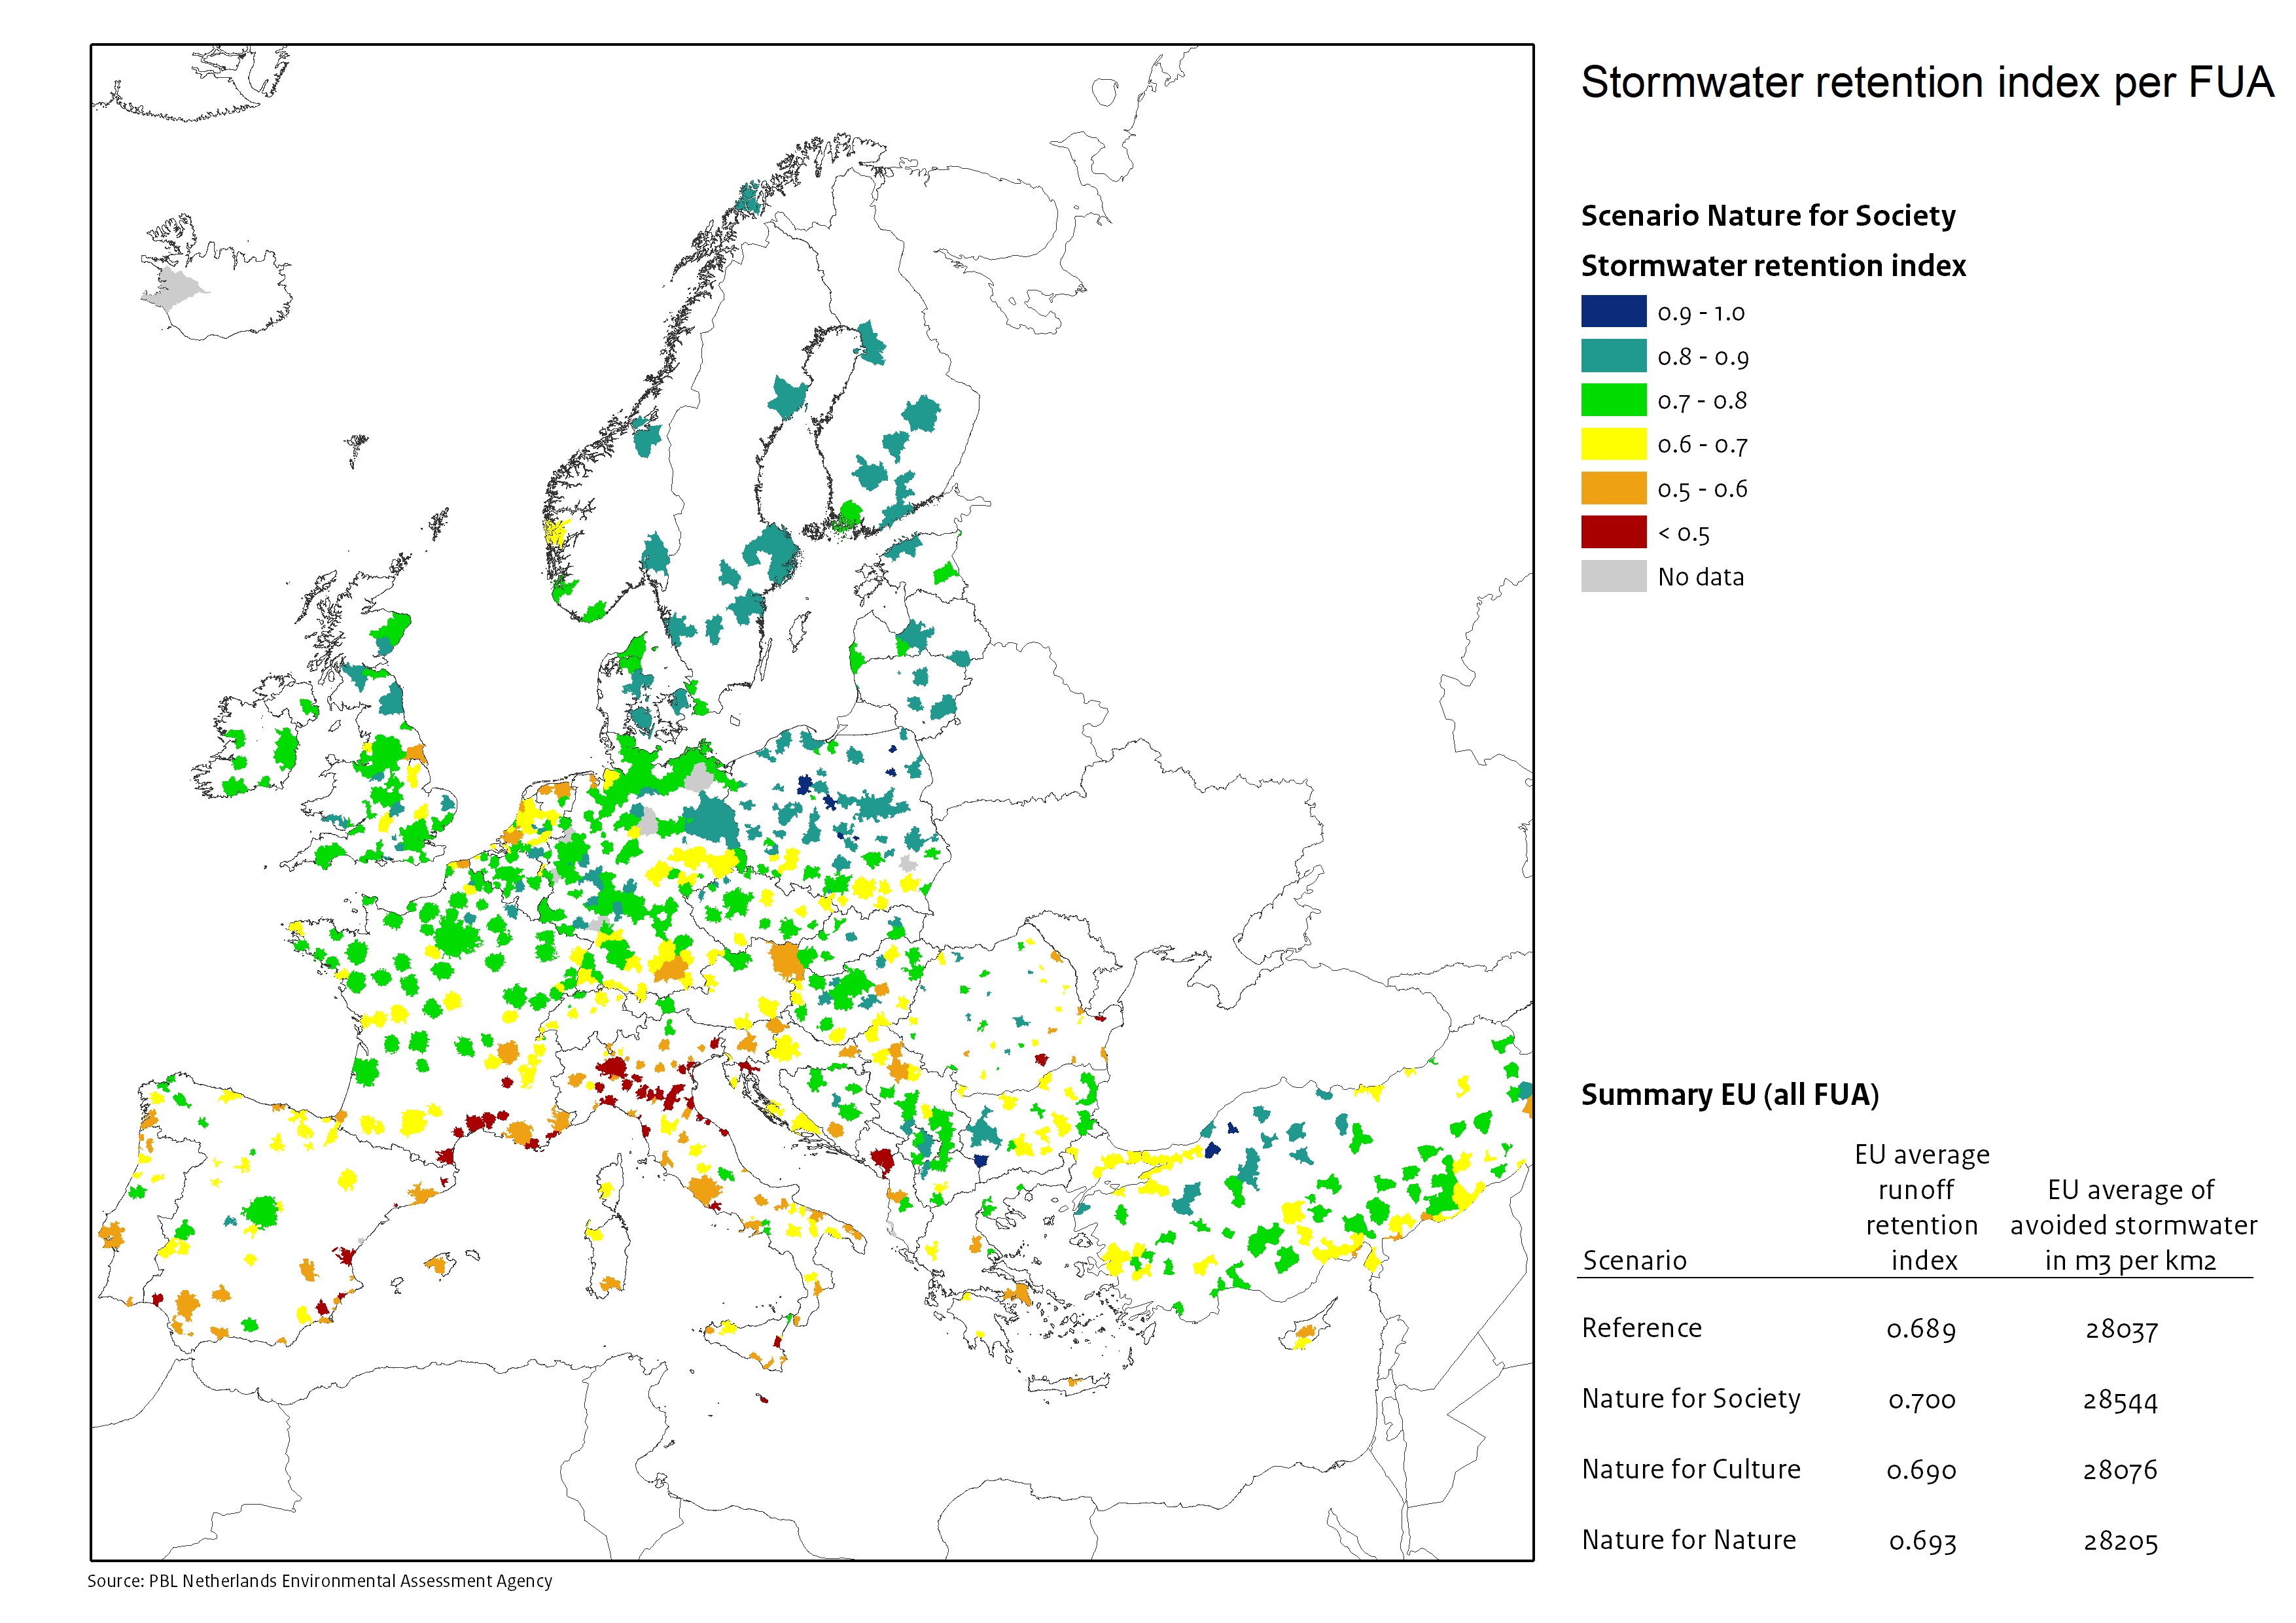
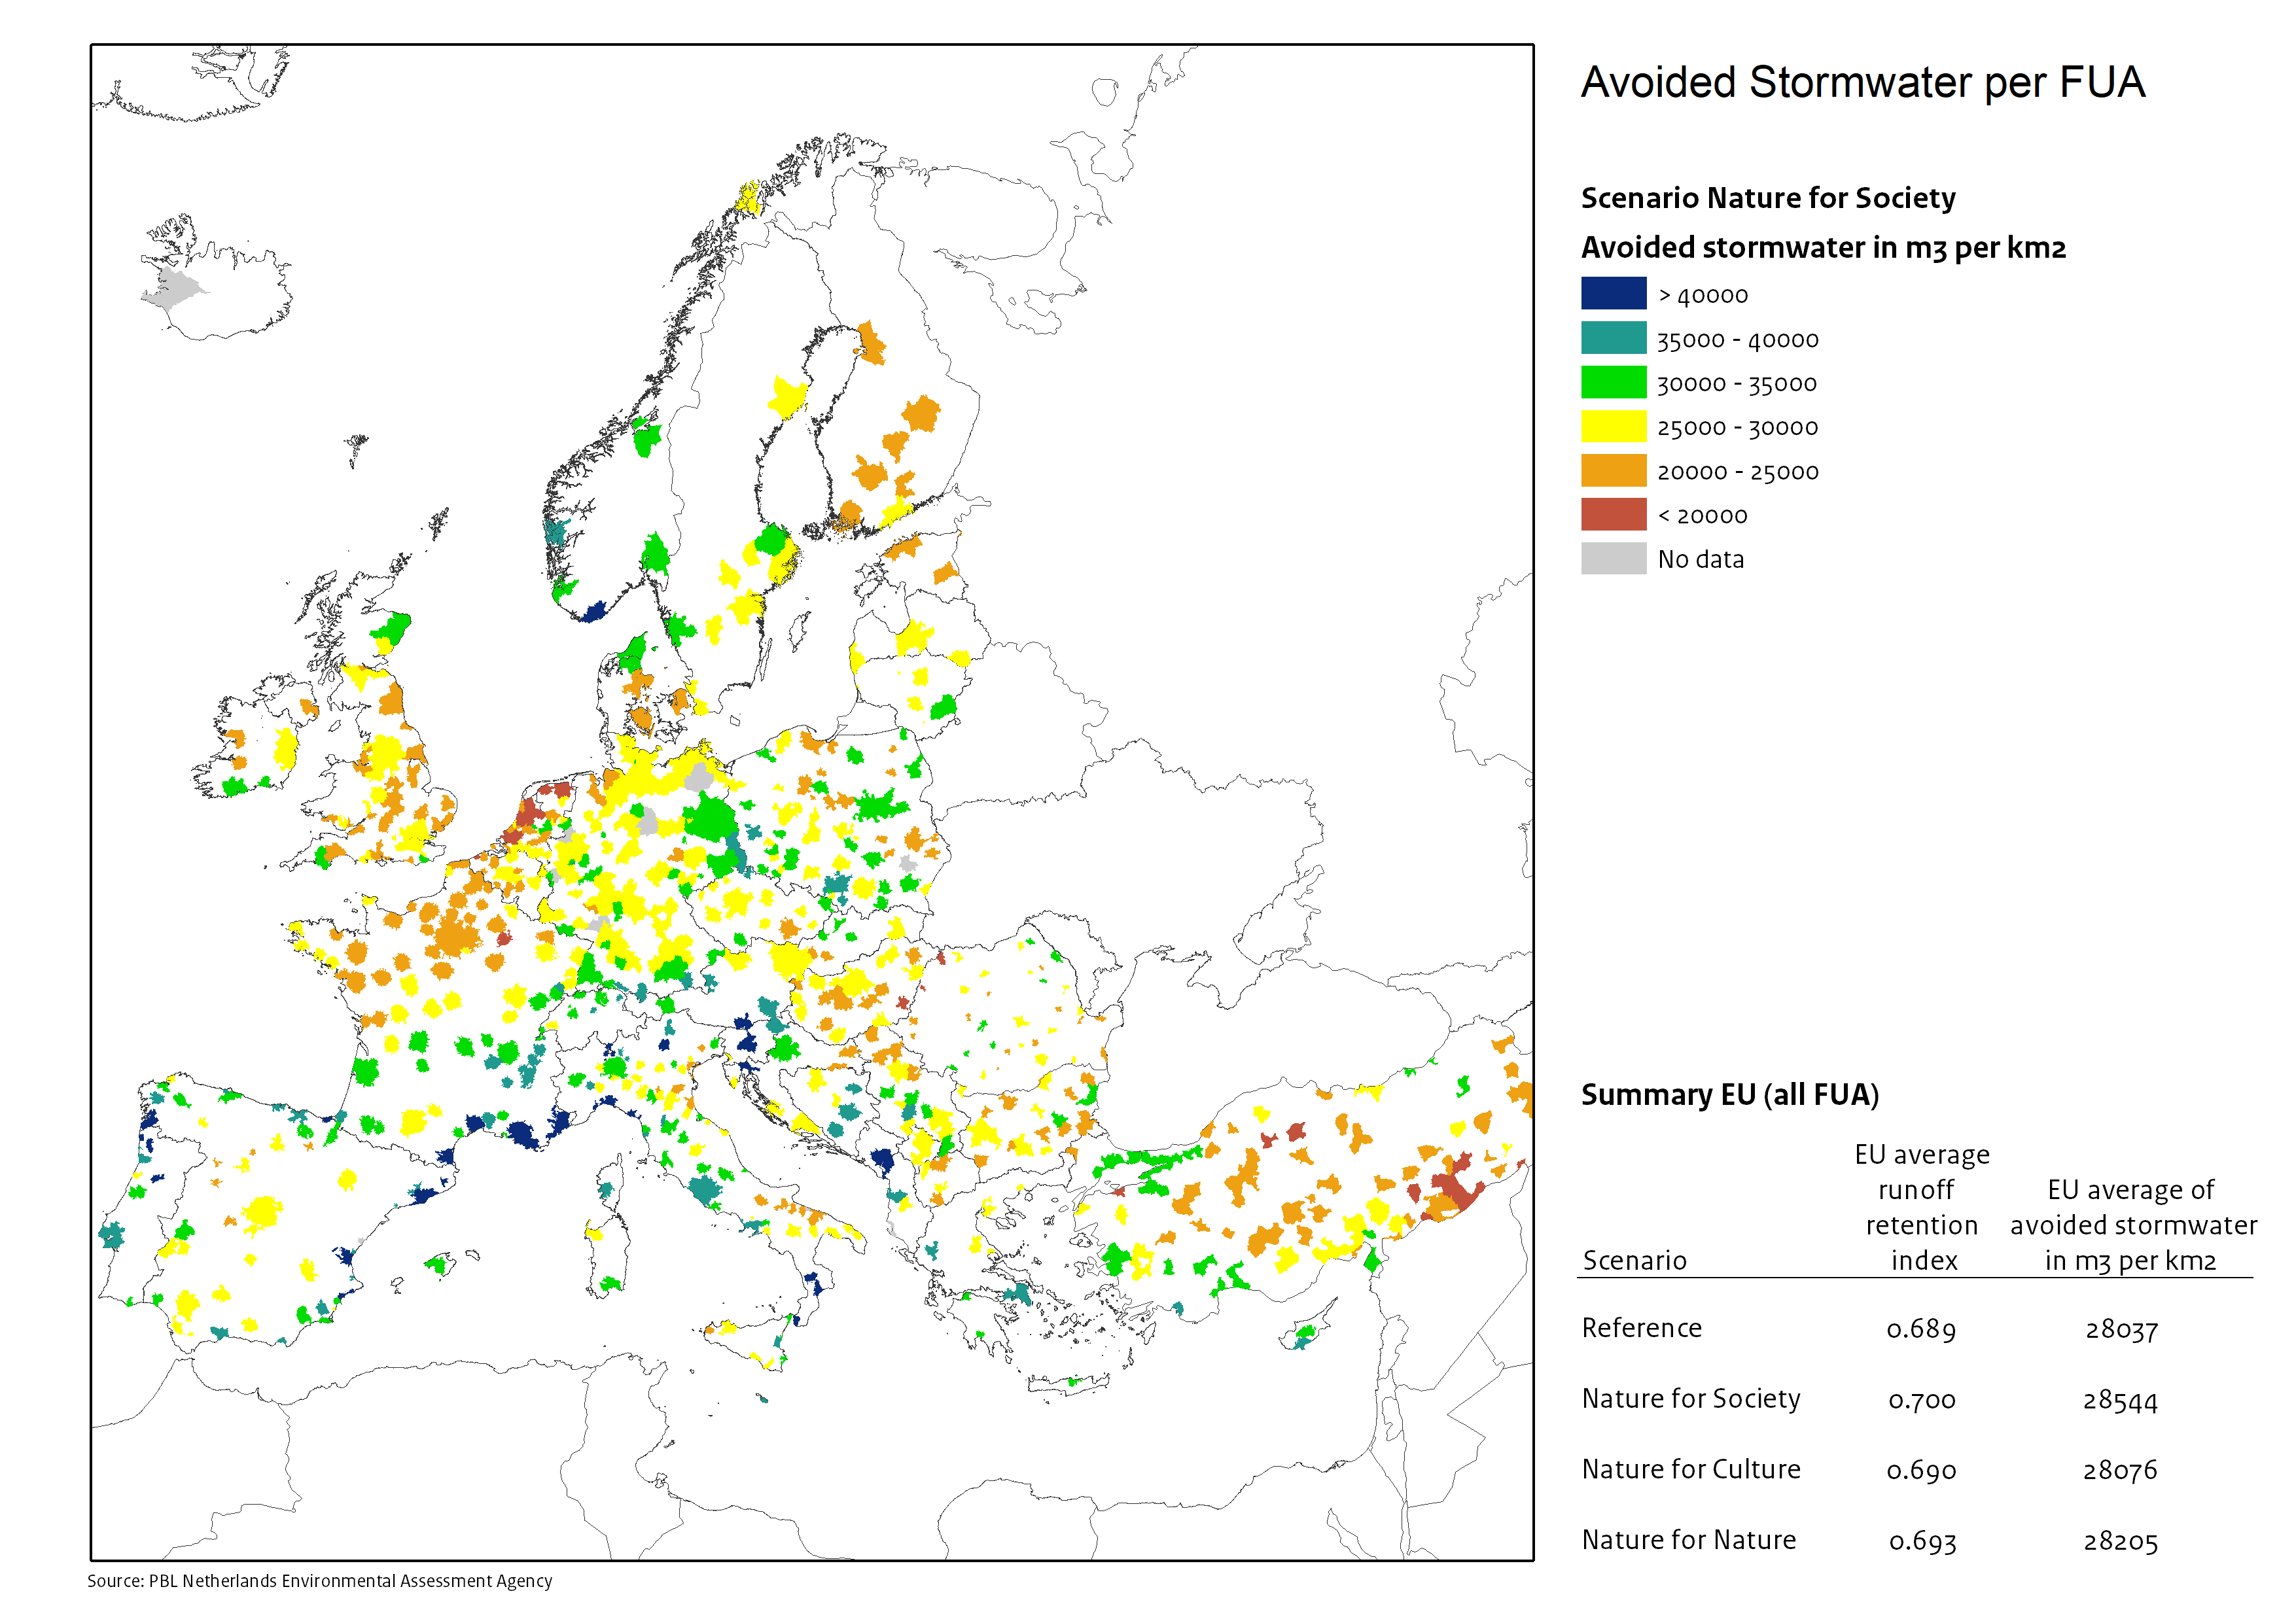
Nature for Society: Integrating nature into the city where people most need it (instrumental value) by implementing additional street trees, permeable surfaces and parks.
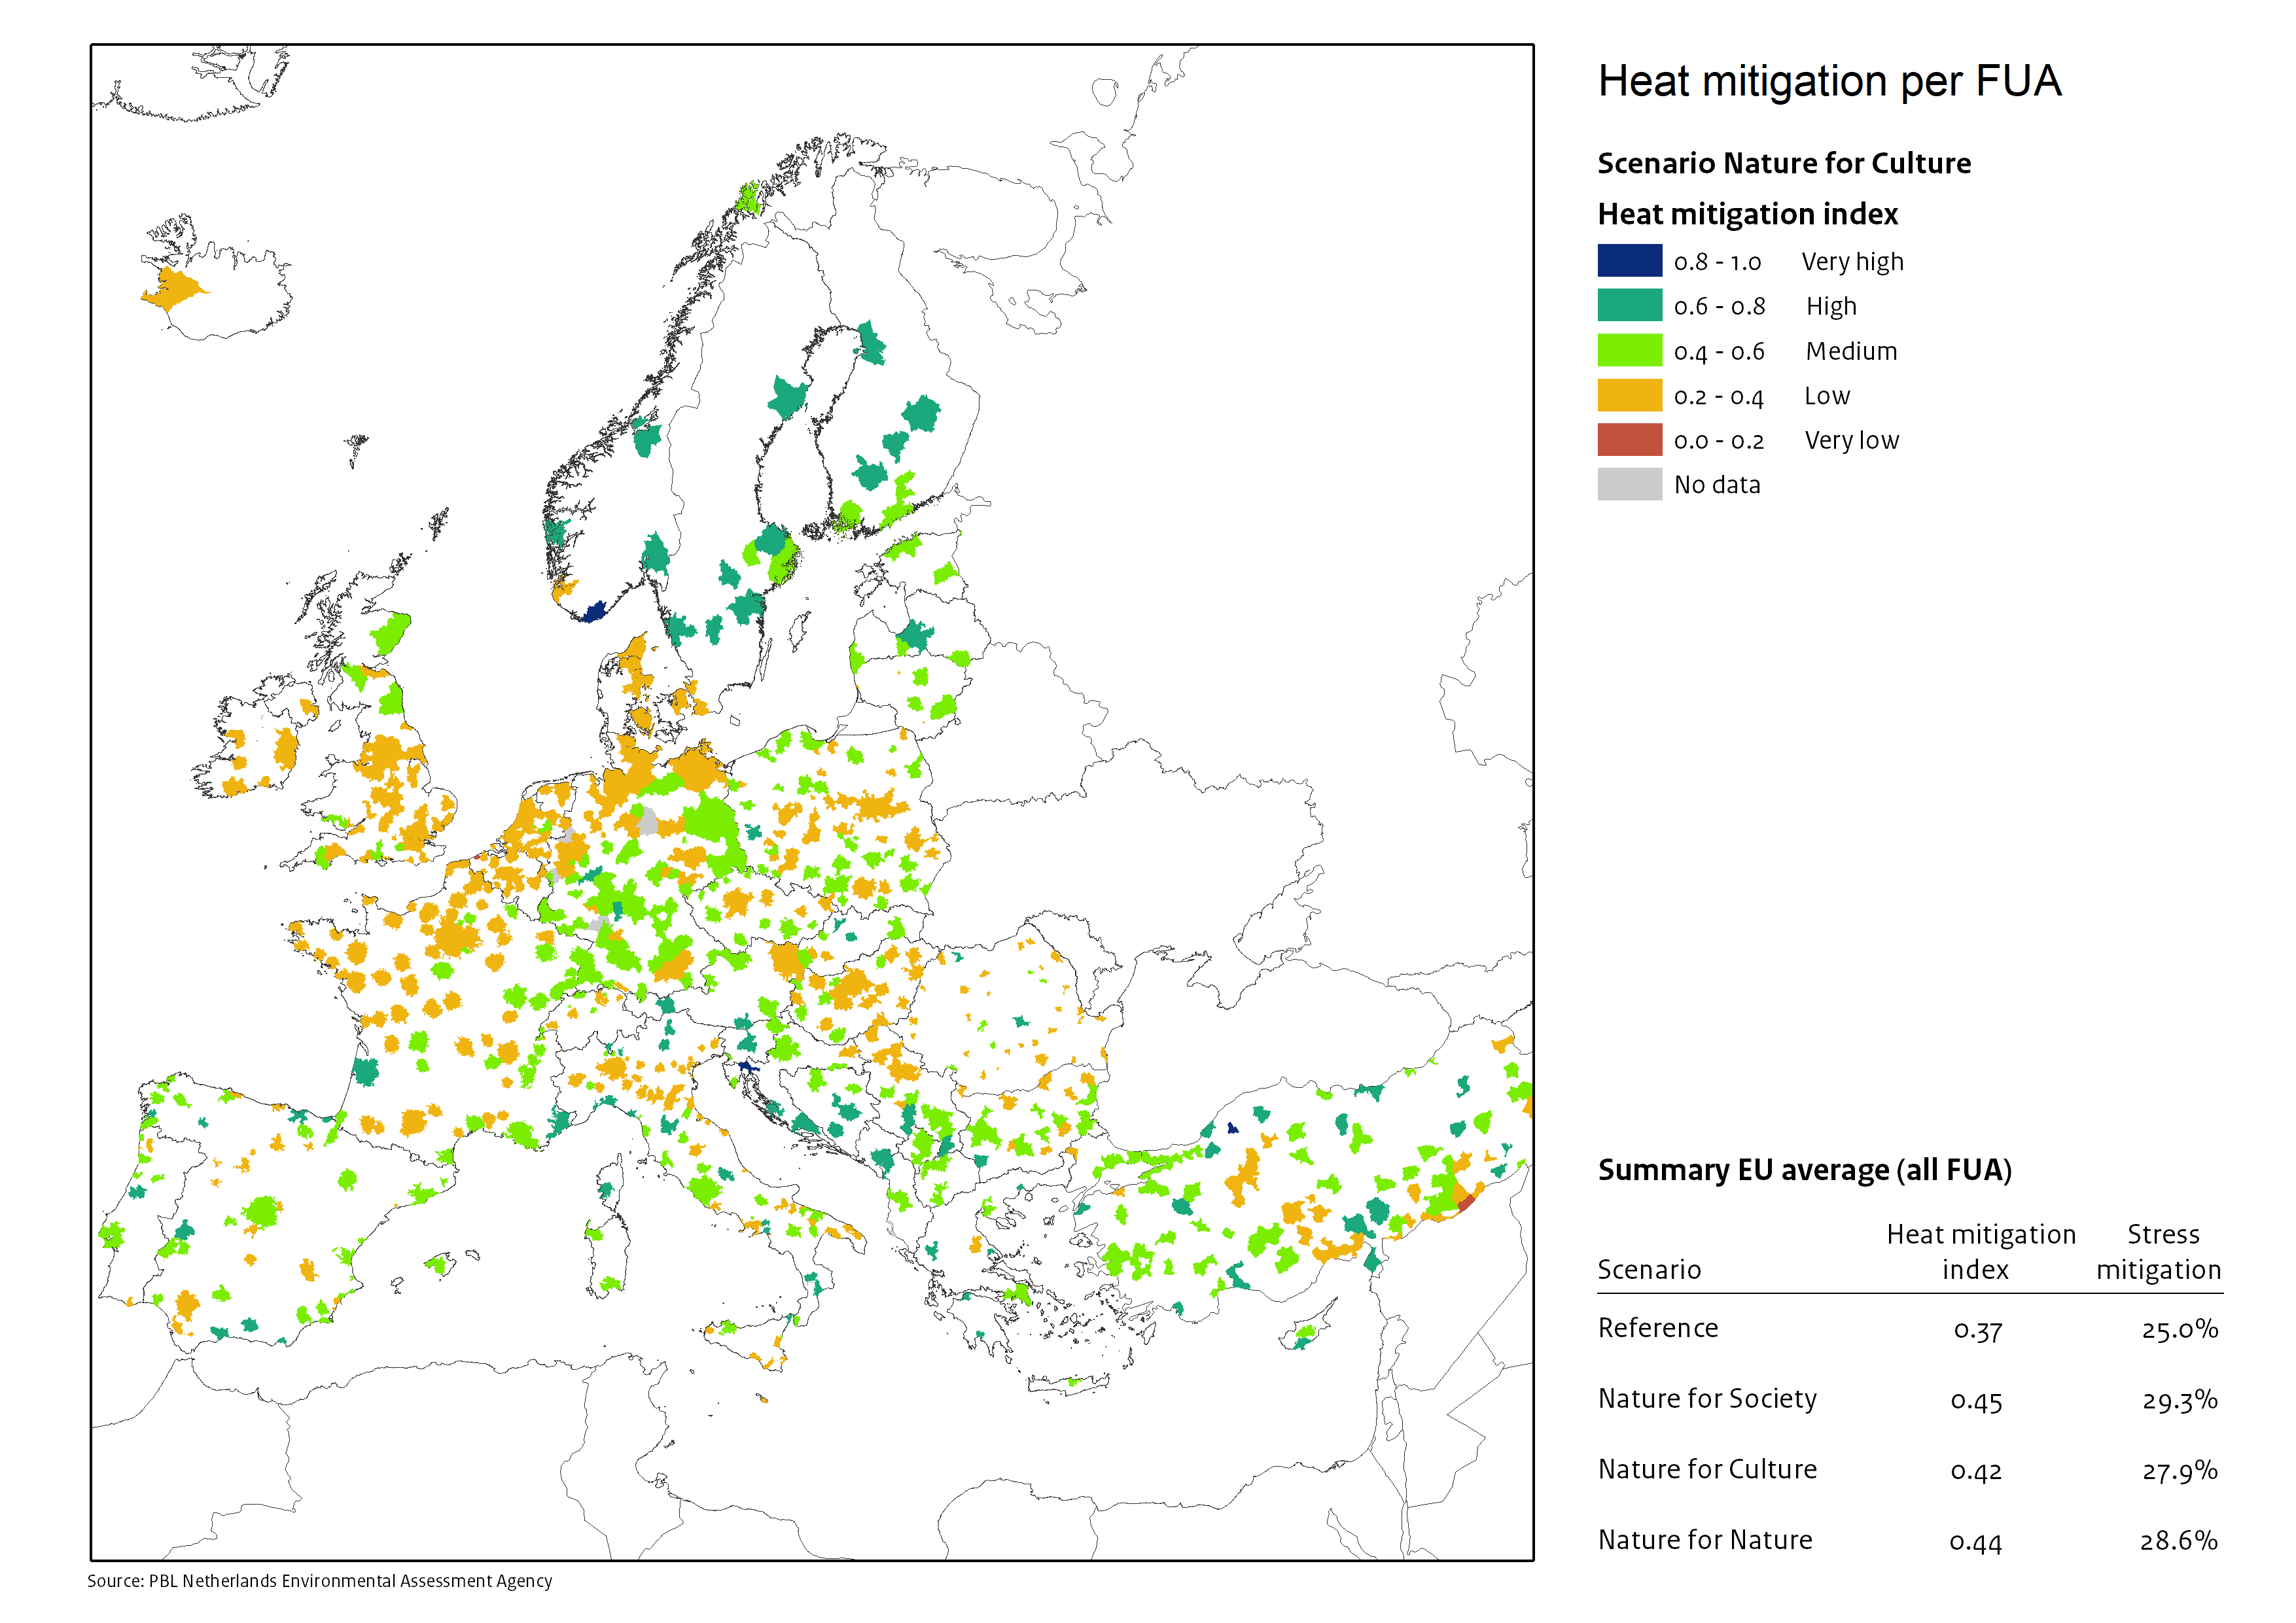
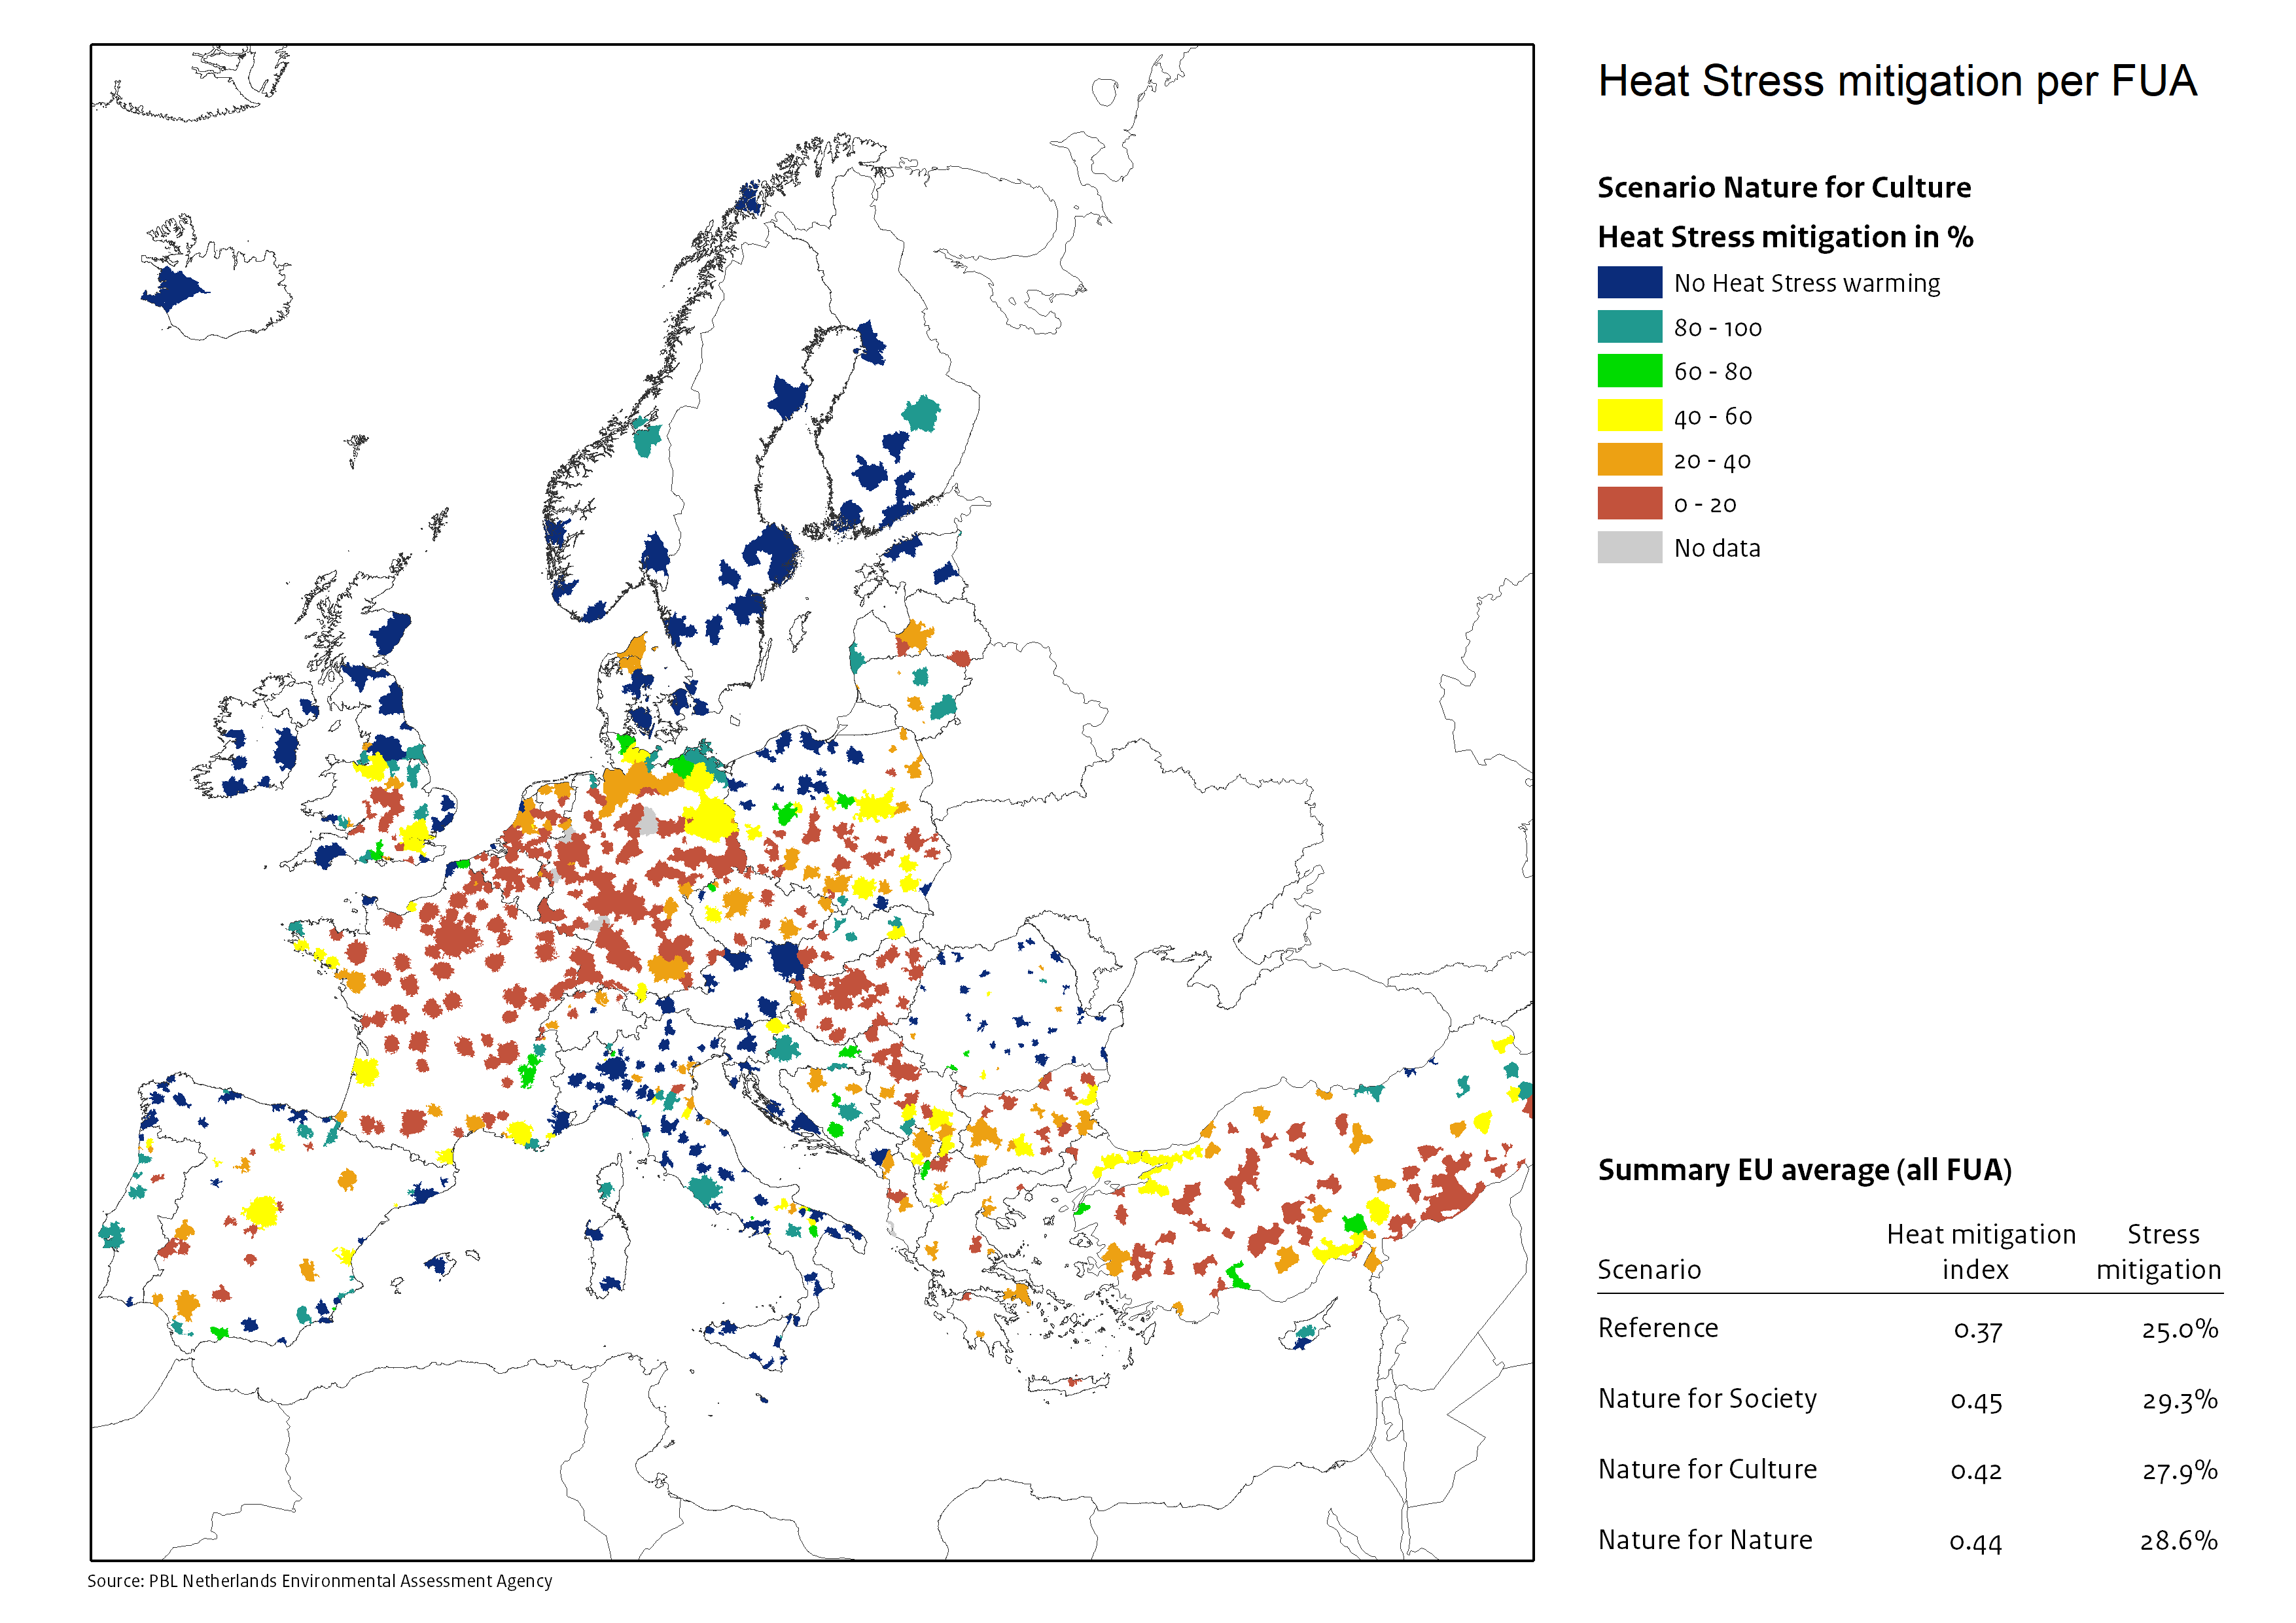
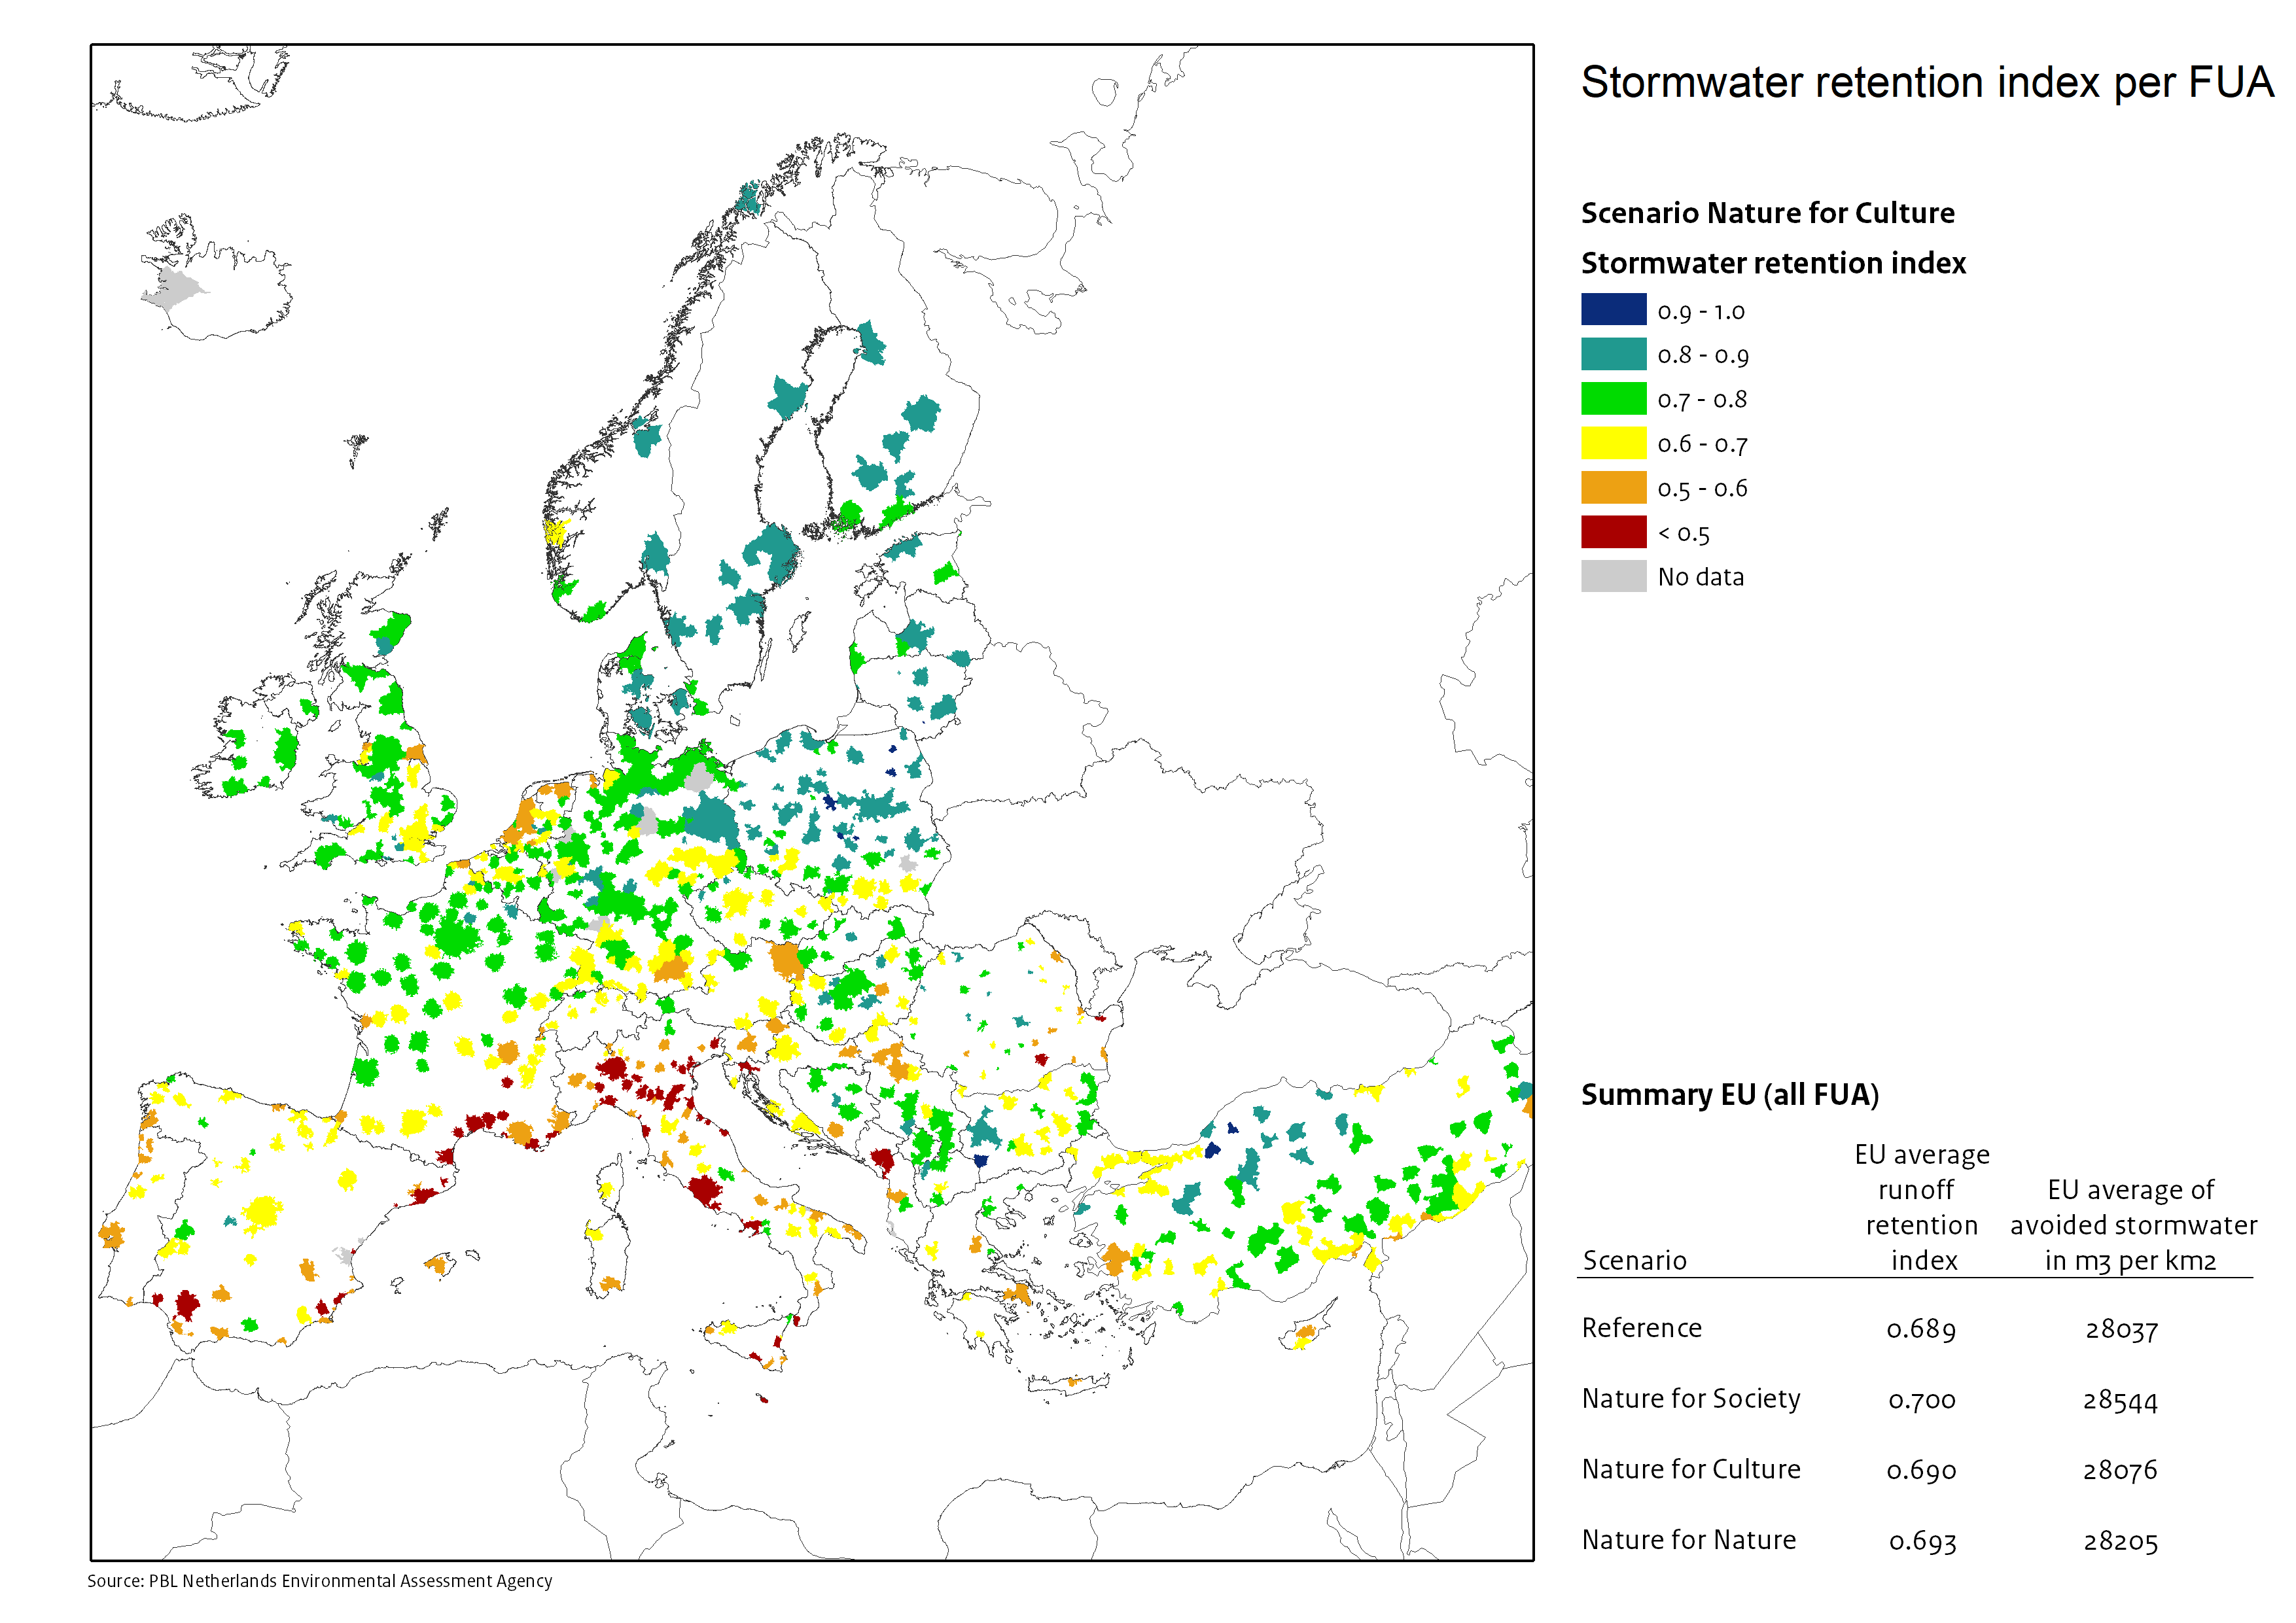
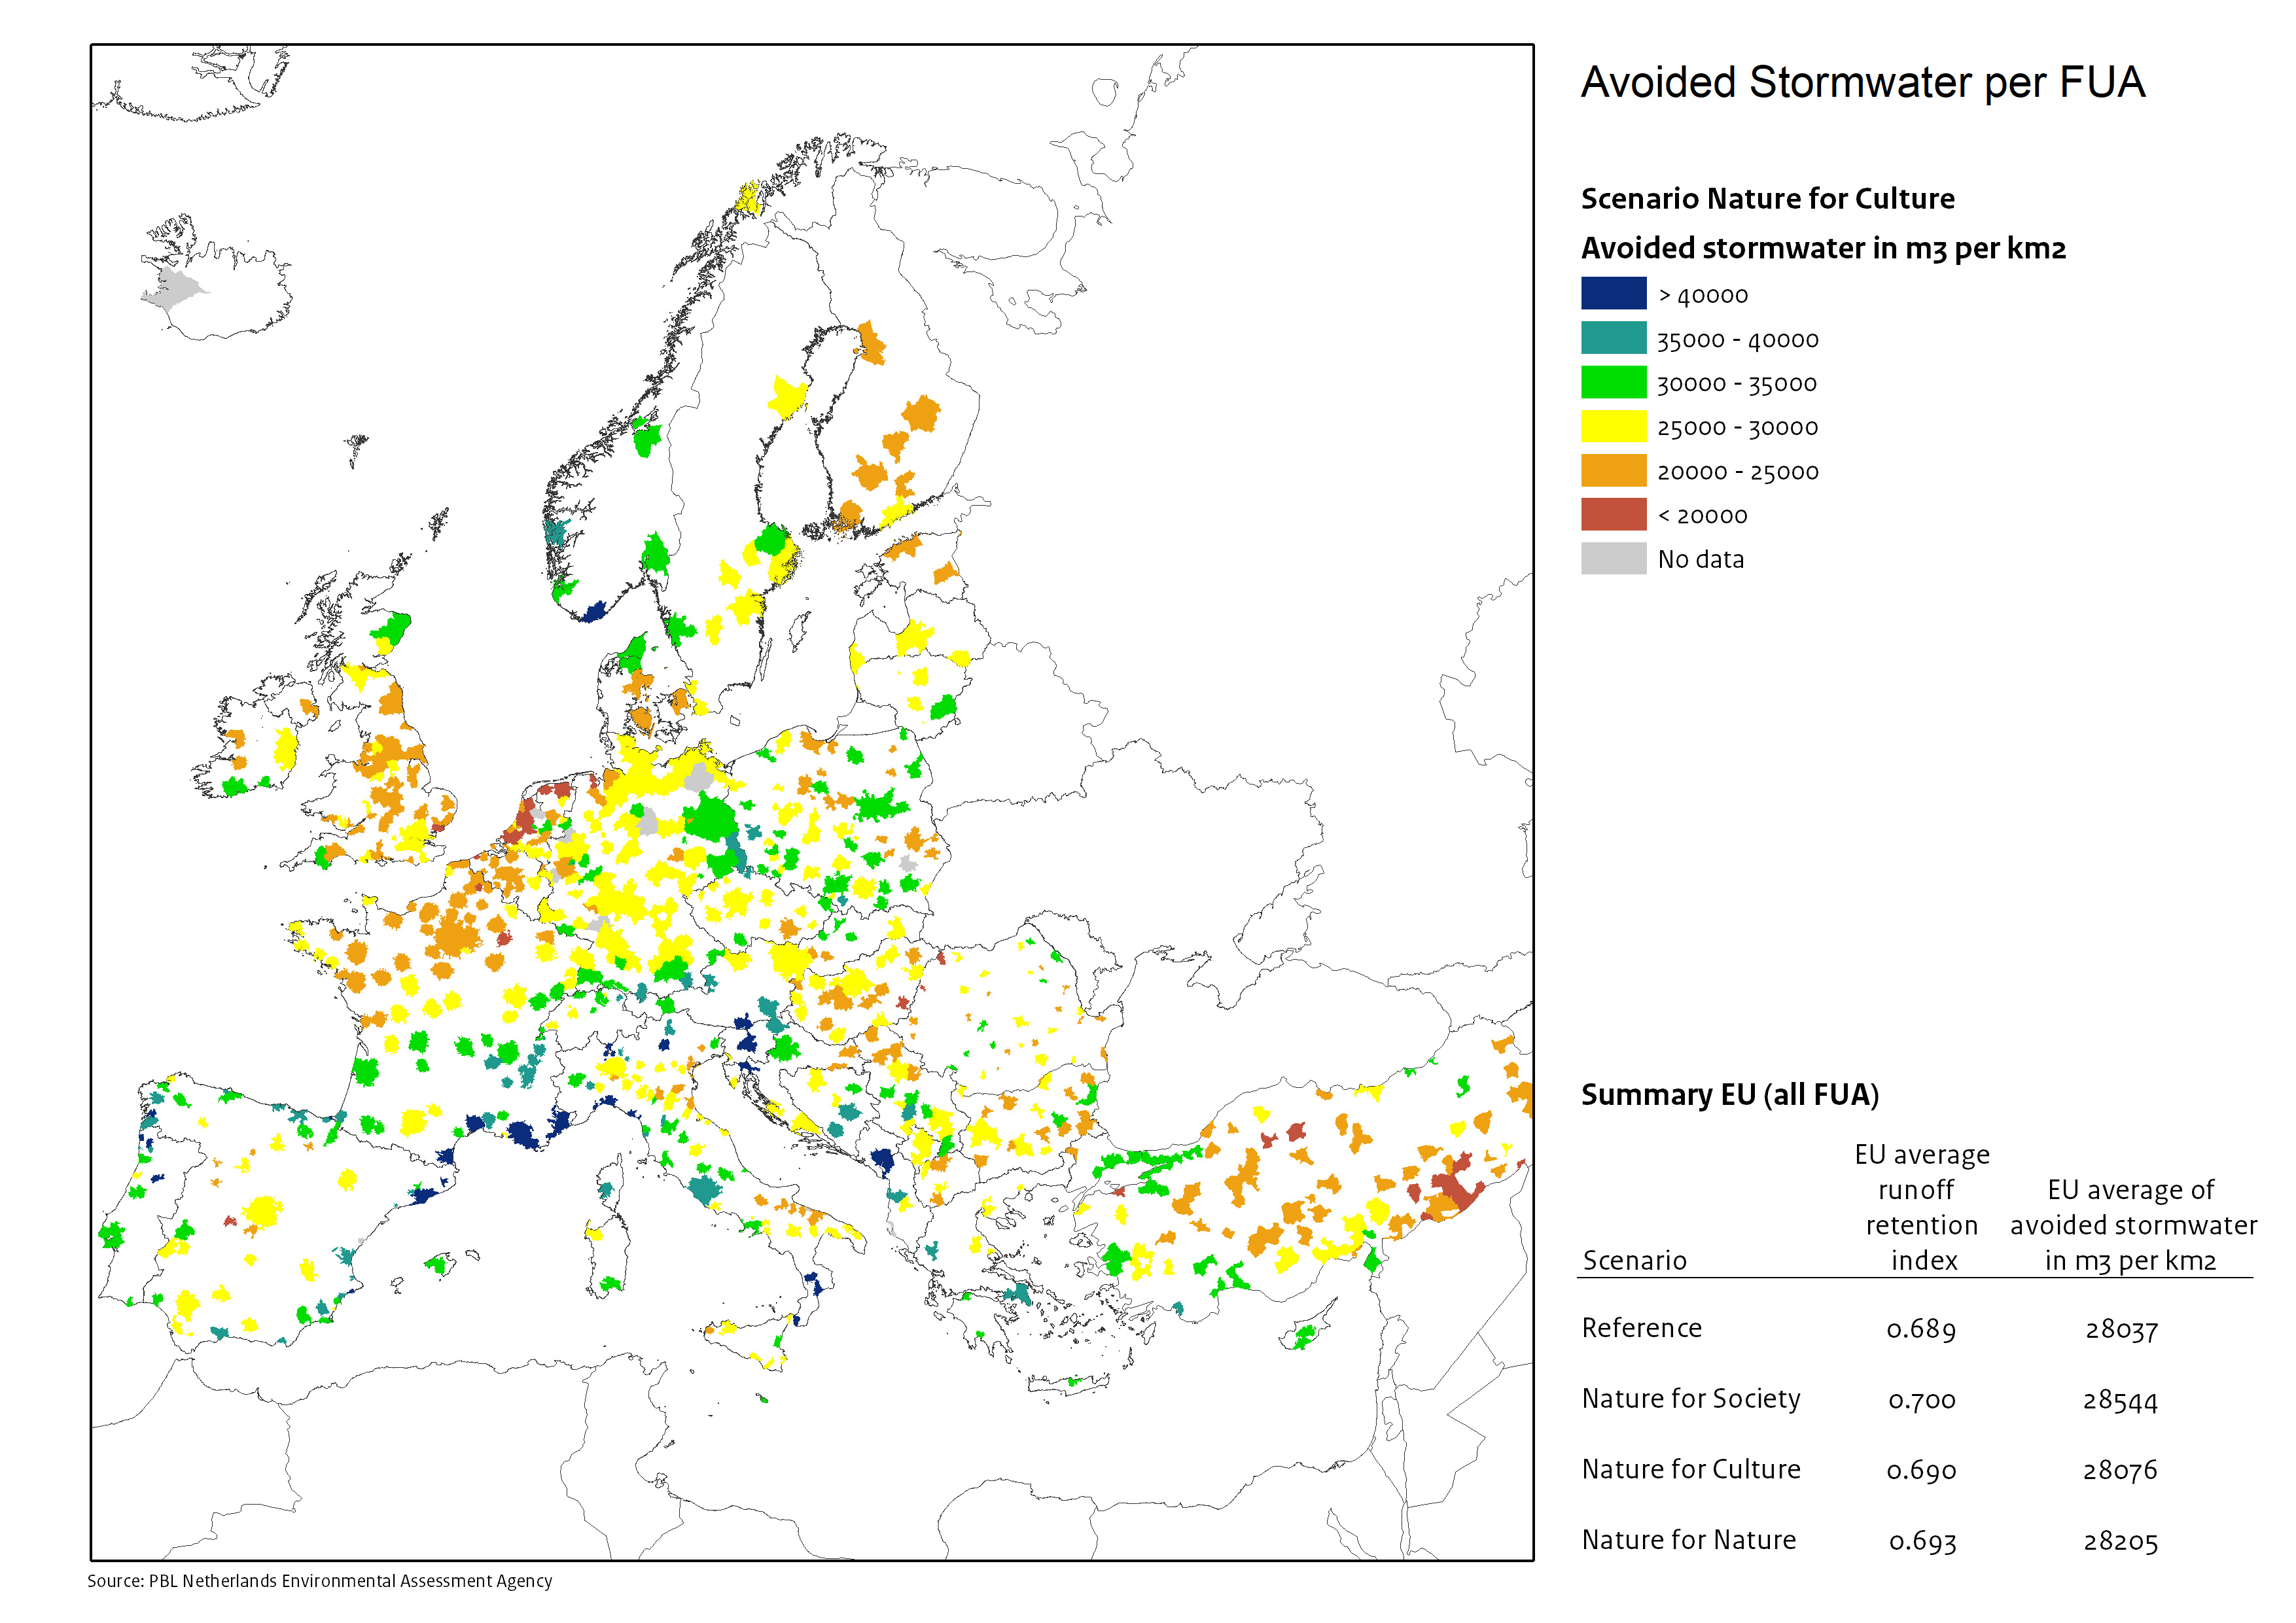
Nature as Culture: Creating ‘attractive’ nature for people to re-connect with nature (relational value) by increasing the amount of public accessible green spaces (e.g. parks, beaches, forests).
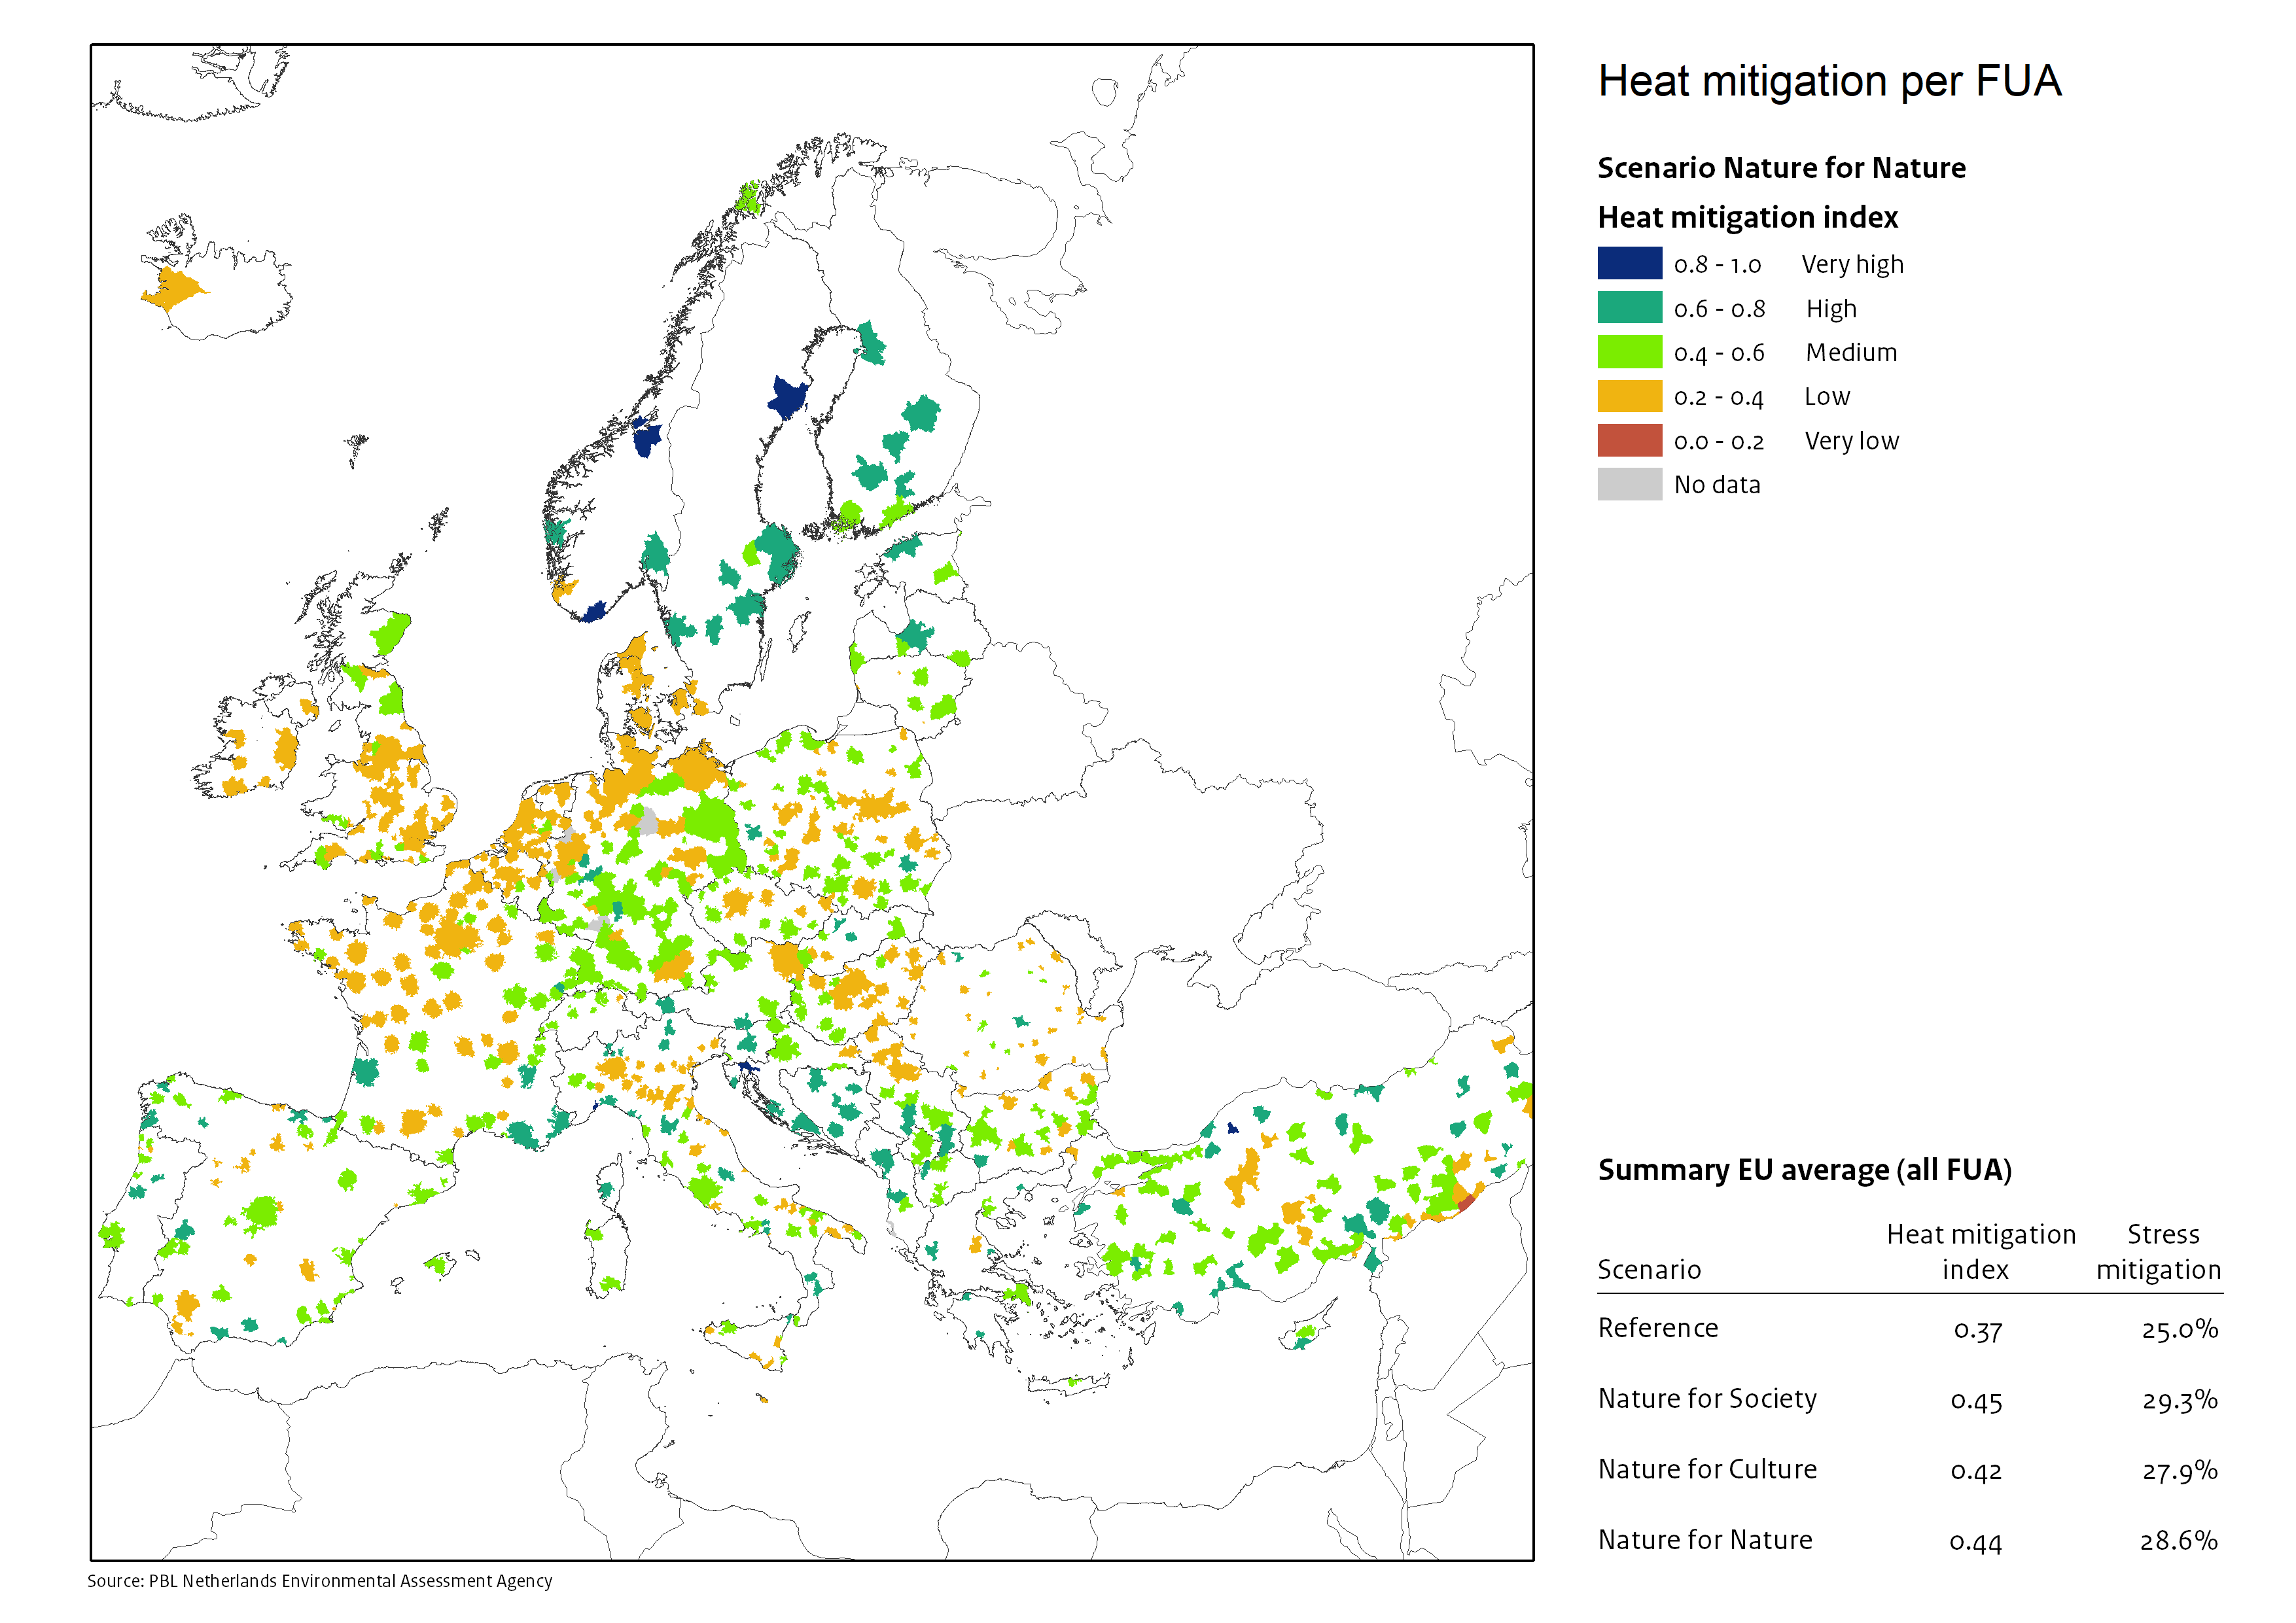
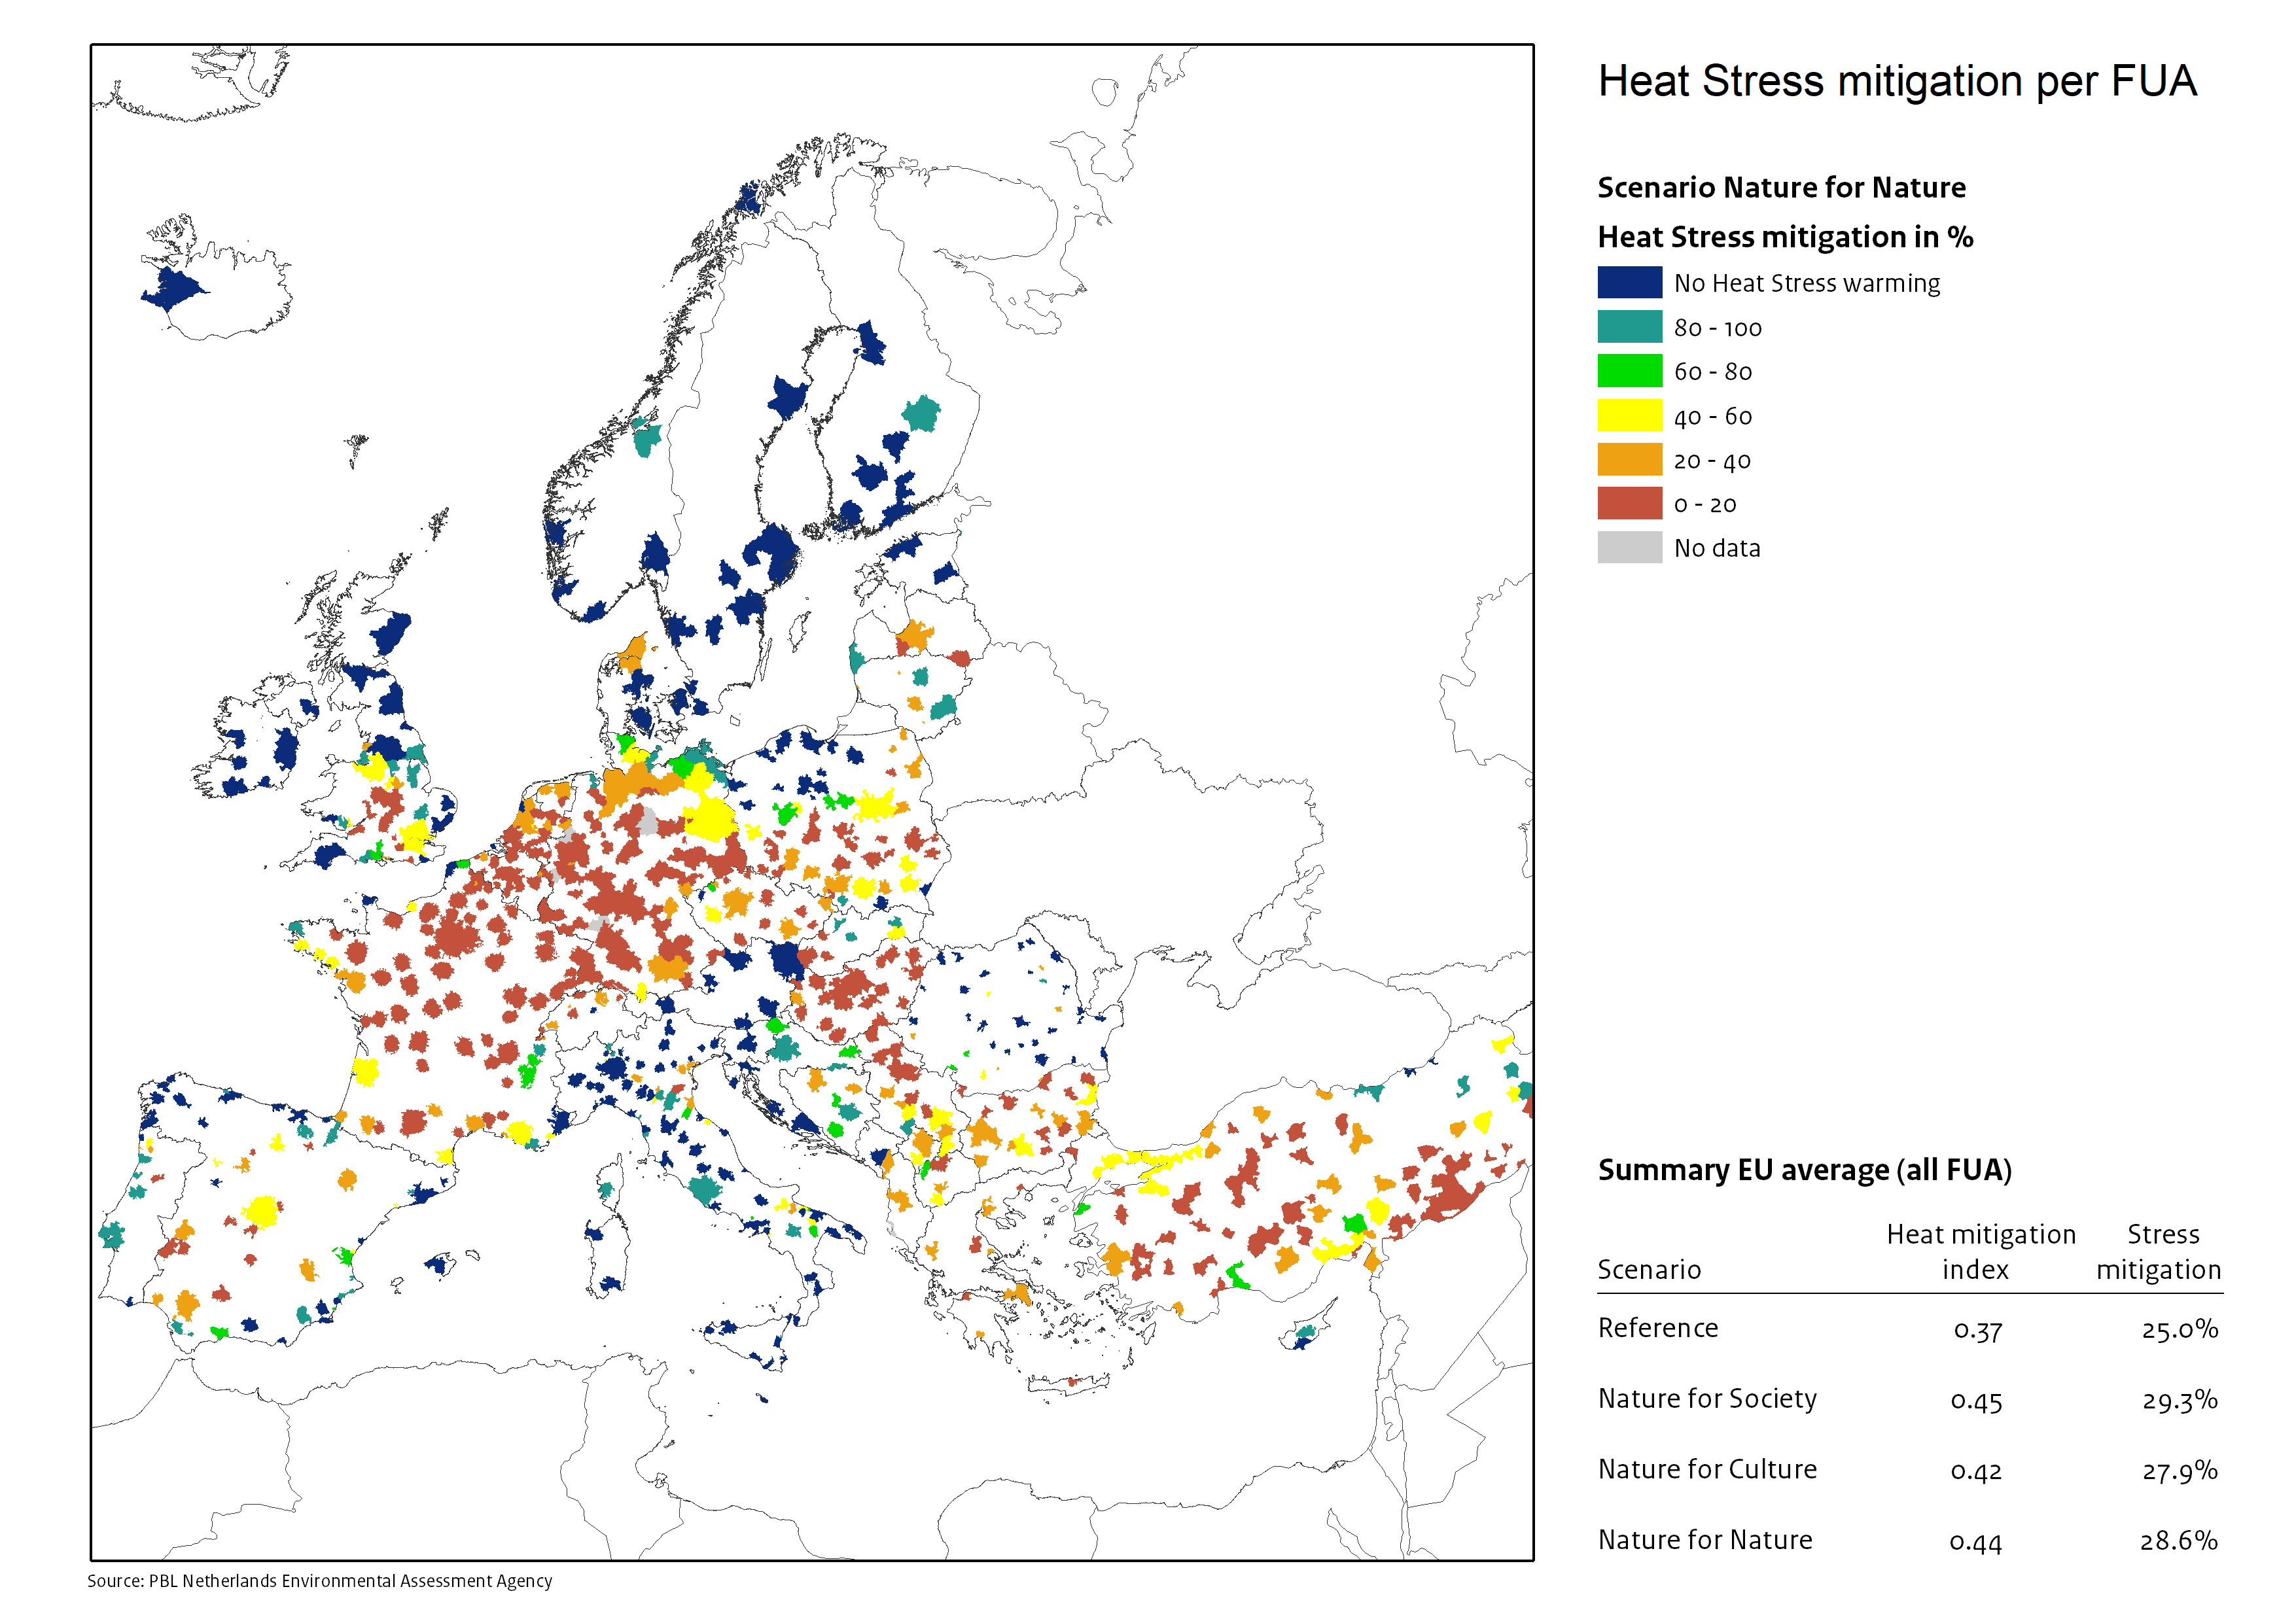
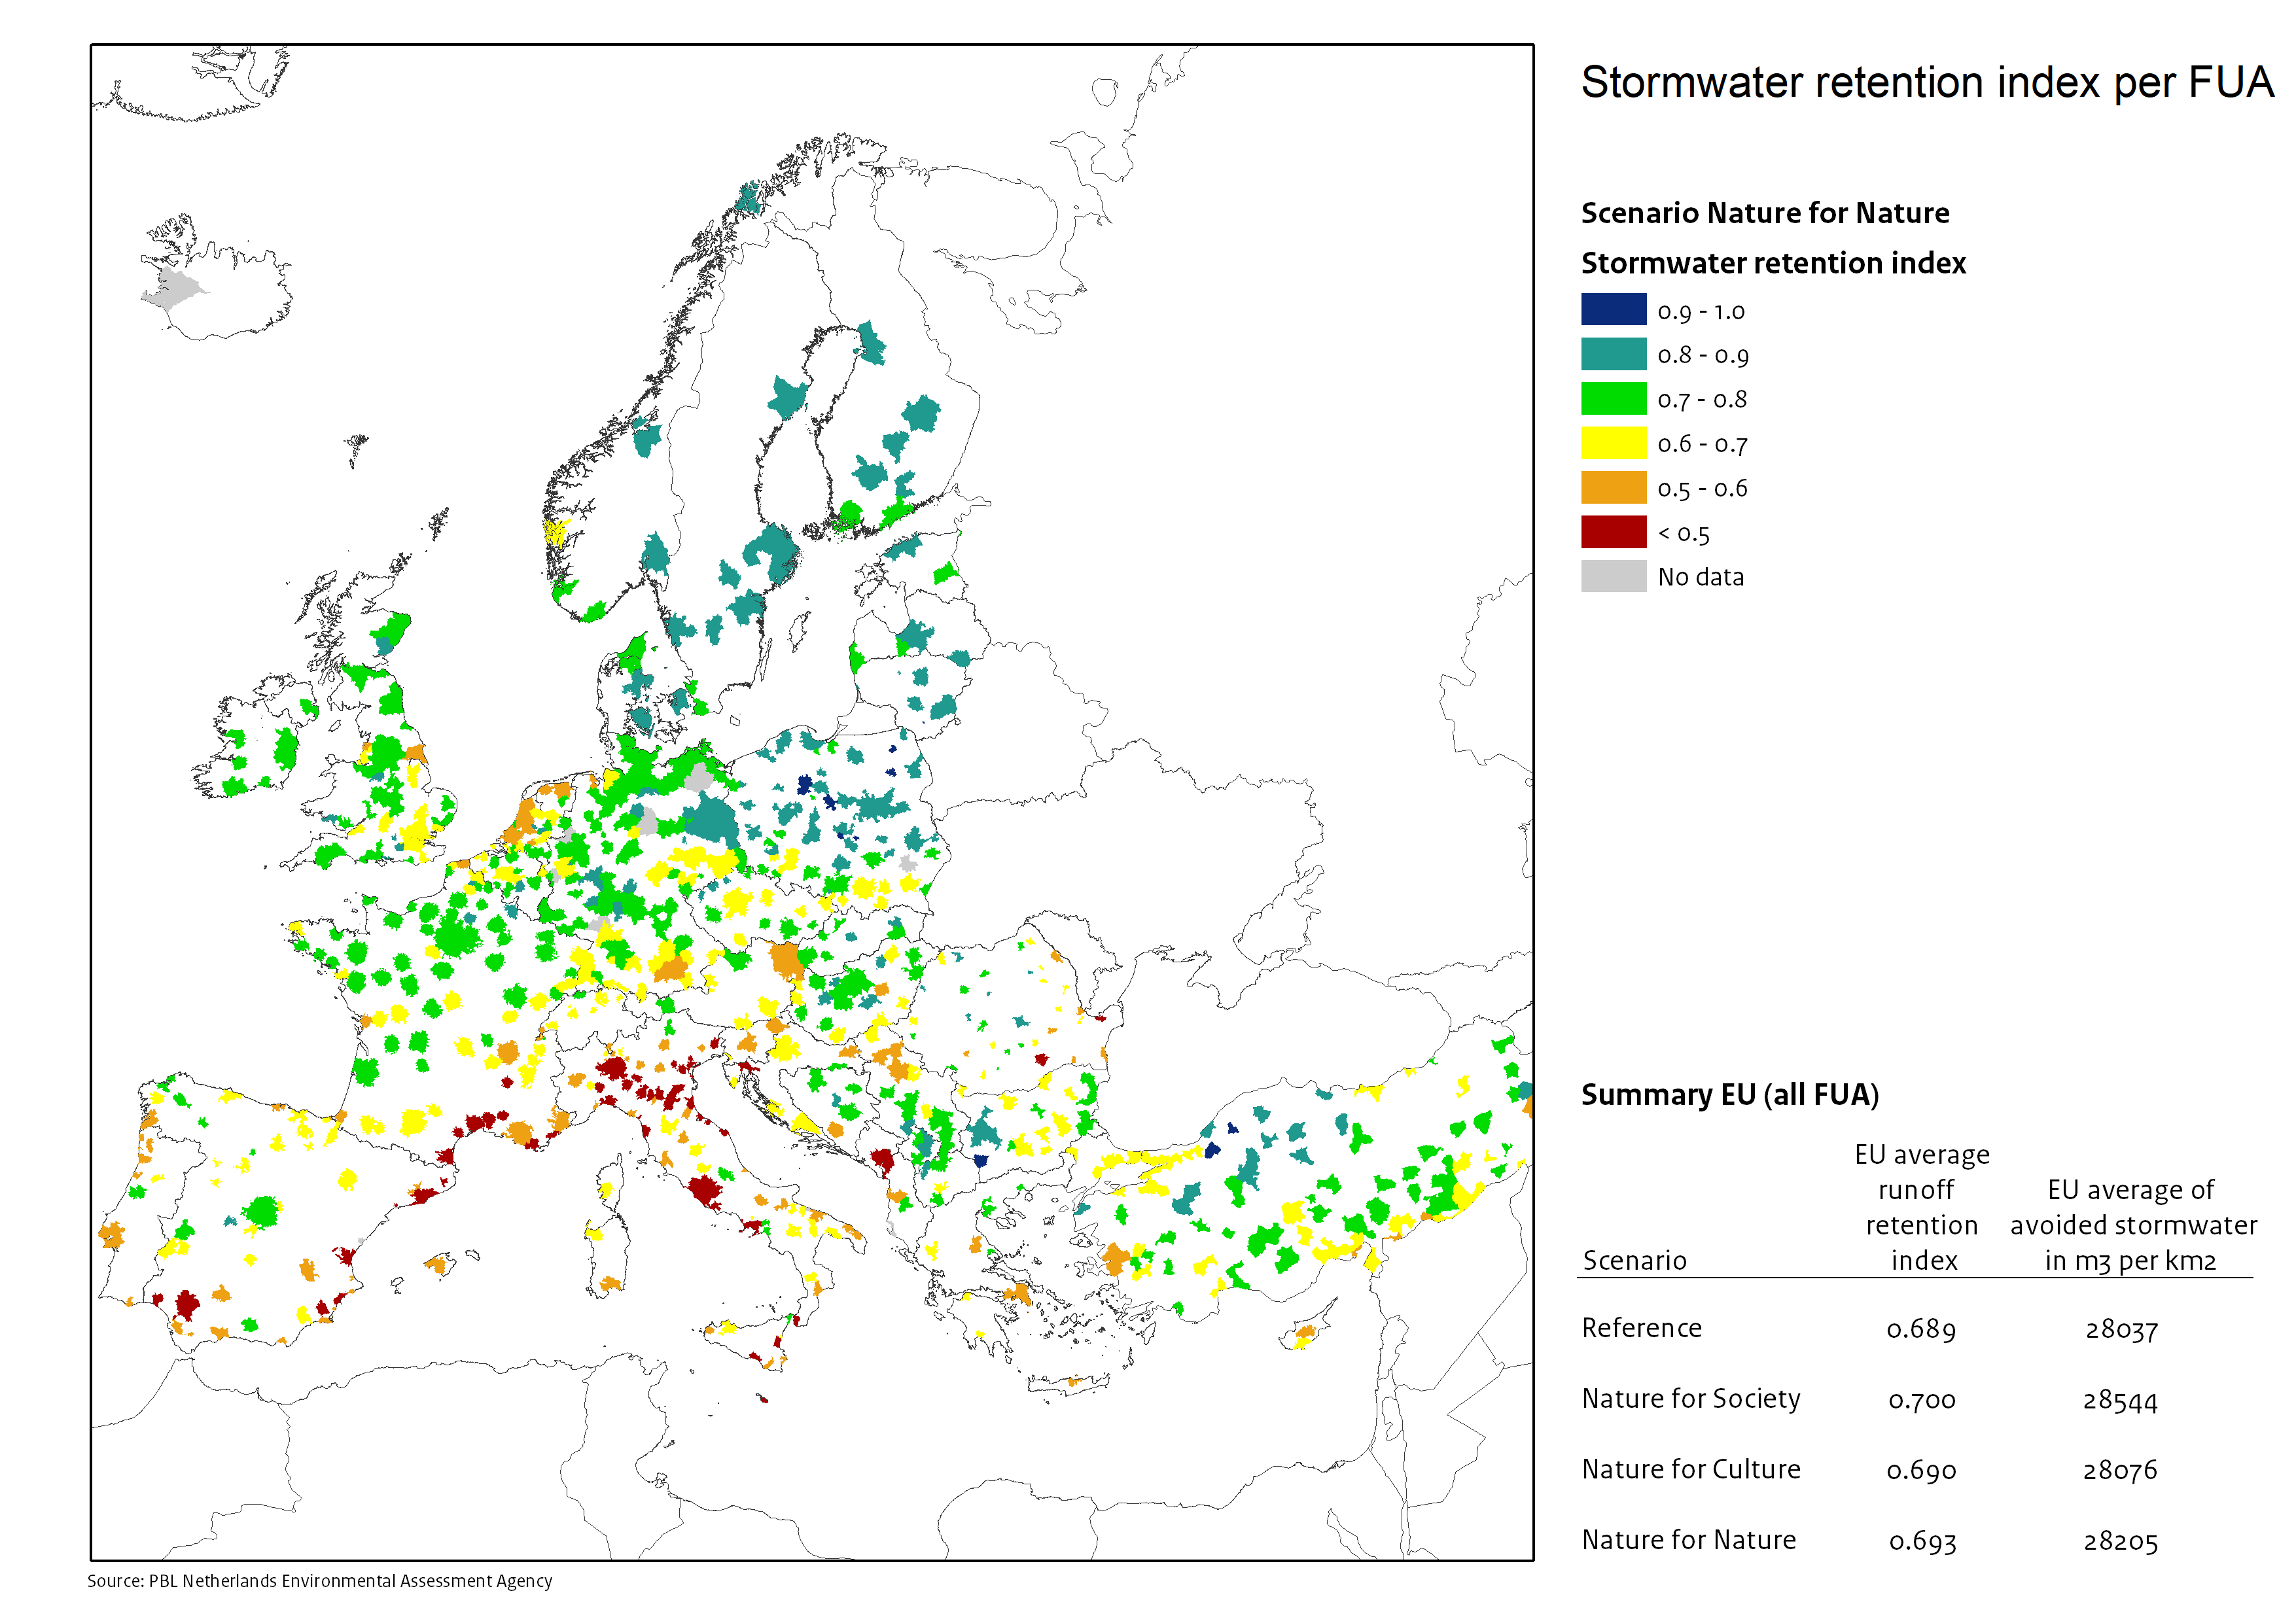
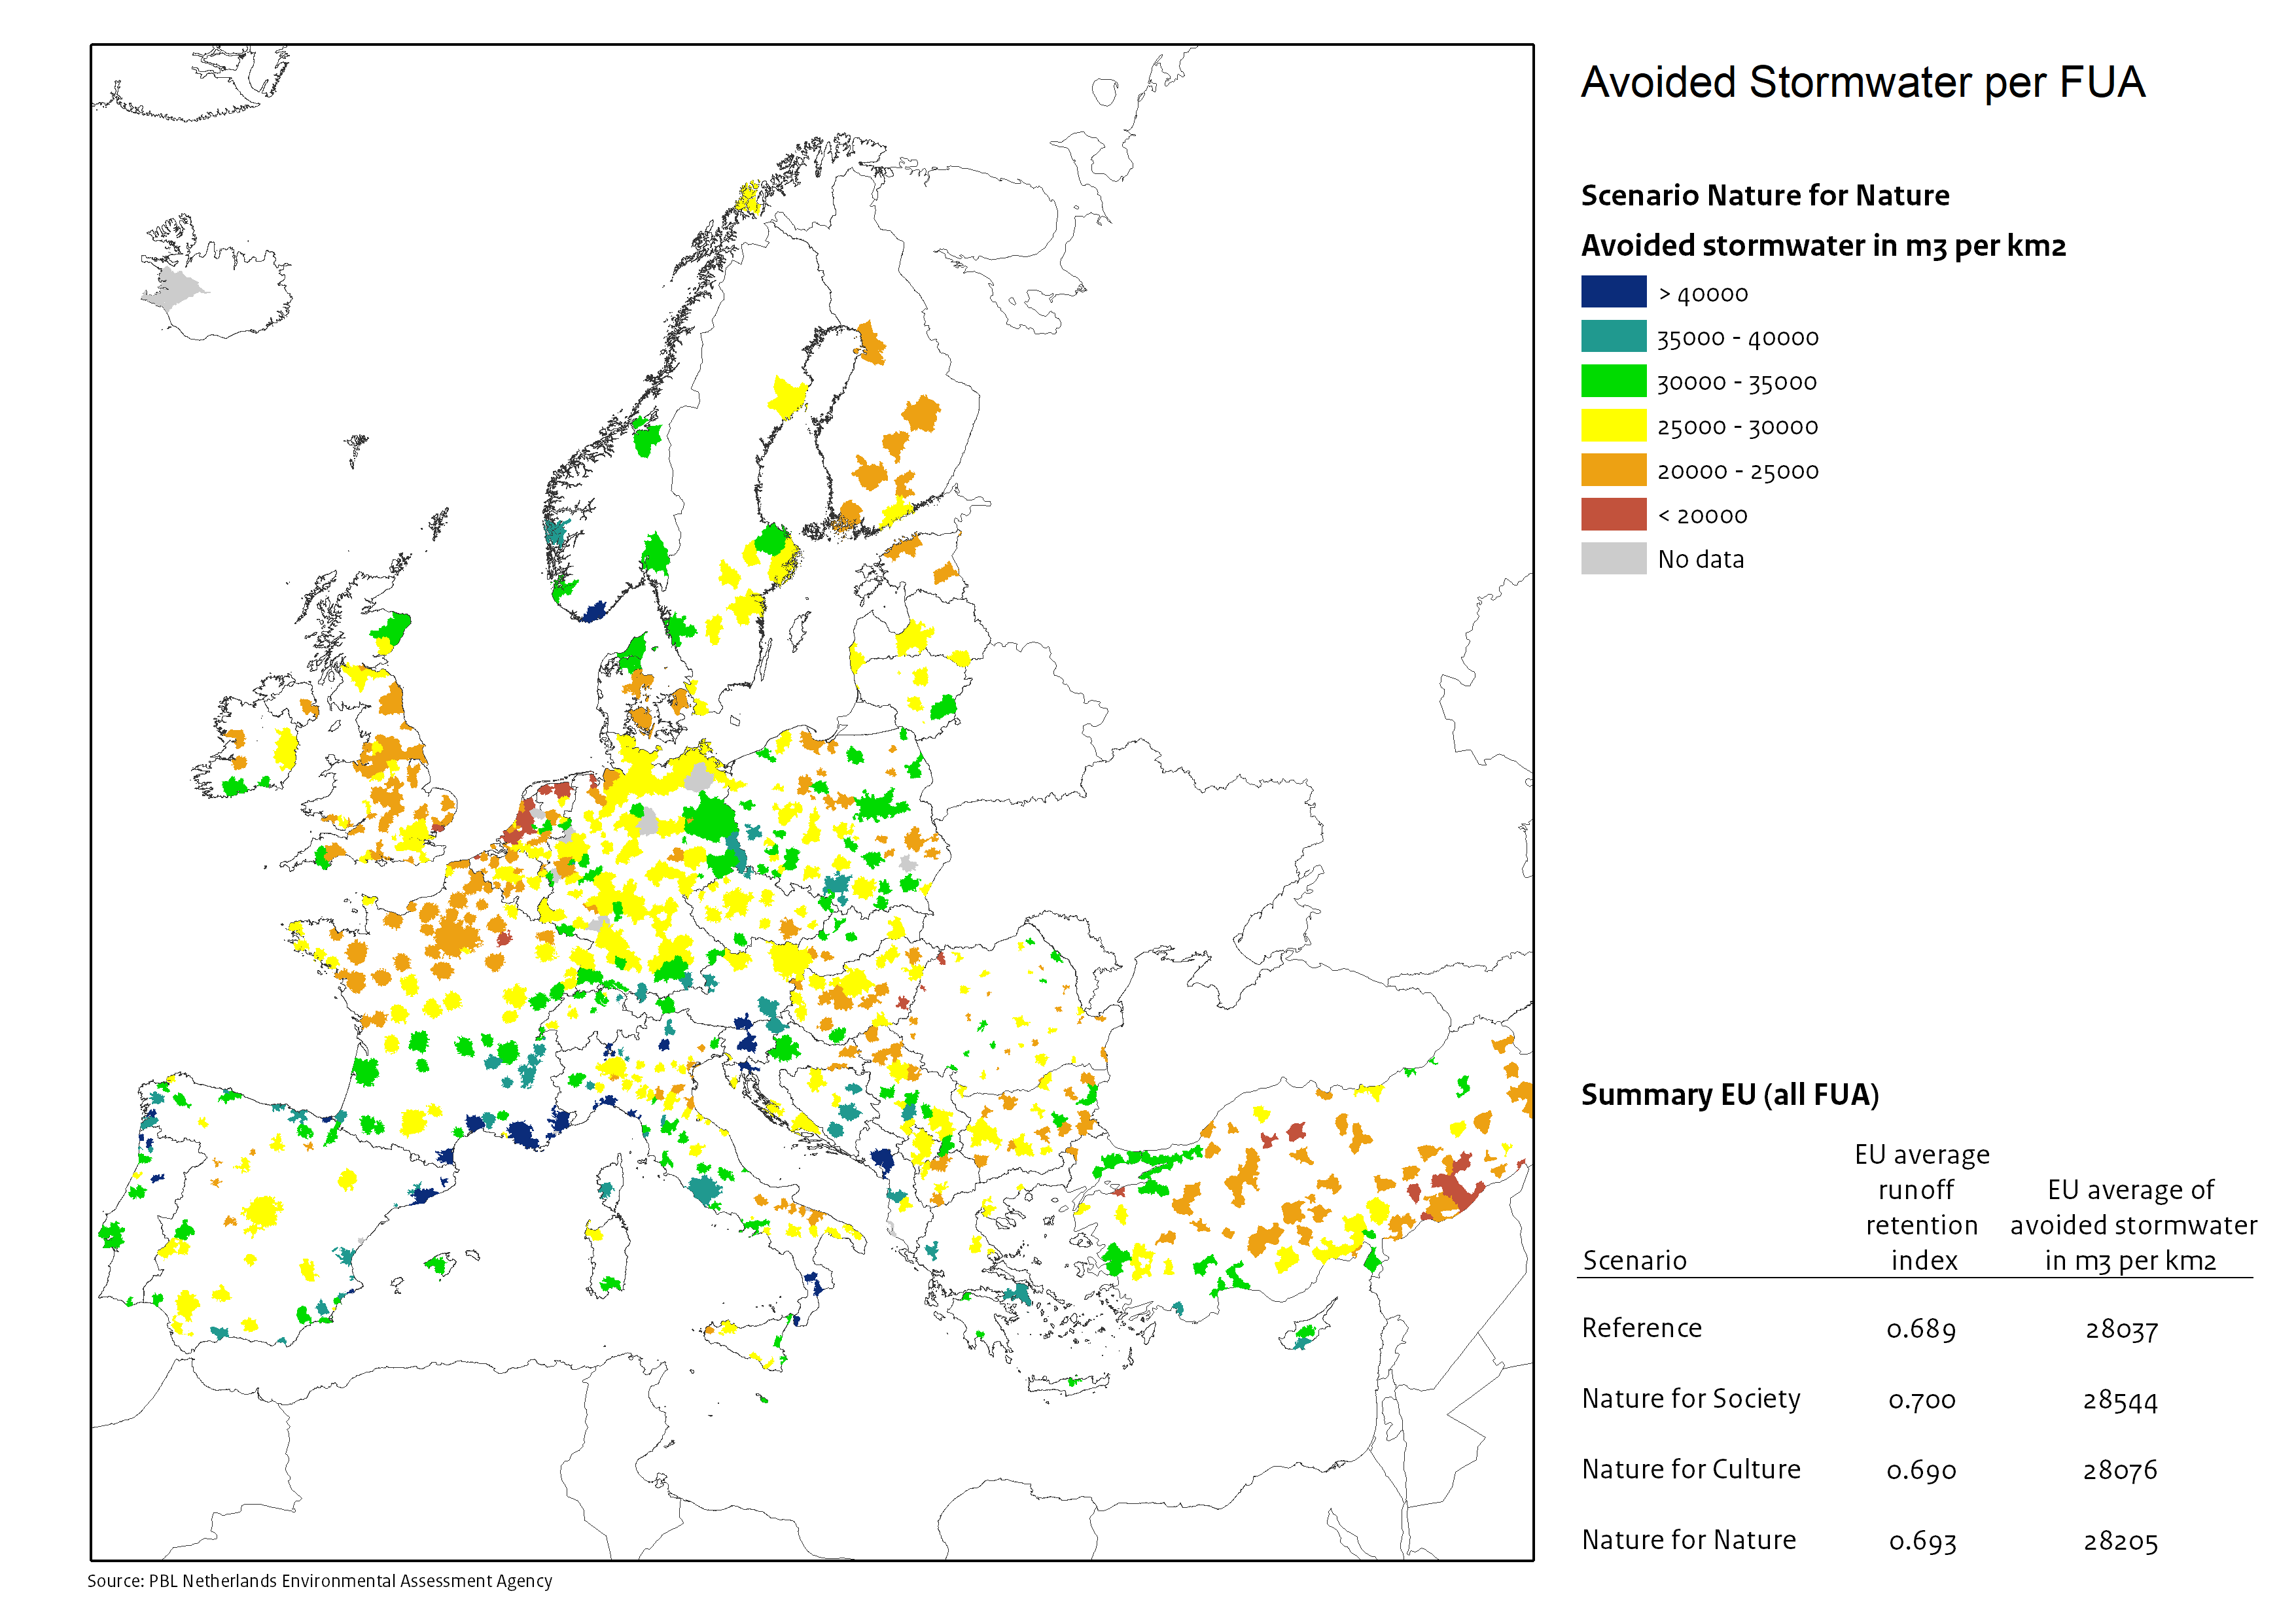
Nature for Nature: Bringing nature back into the city (intrinsic value) by creating additional space for semi-natural green areas (e.g., forests, grasslands).
Benefits of urban nature-based solutions
Biodiversity: Potentially occurring fraction of species (POF), measuring the proportion of birds and flying insects populations which could potentially survive in the urban area based on the availability of semi-natural habitat within 100 m and 1000 m distance. ‘0’ refers to low potential ‘1’ refers to highest potential (all species potentially occur).
Carbon storage potential: Amount of carbon stored in living biomass, dead wood, litter and soil, which contributes to reducing atmospheric carbon concentrations and global warming. The map shows the average carbon storage (kton C/km2) per city, as well as the average carbon storage (kton C/km2) and total amount of carbon (Gton C) stored in European cities under a specific scenario.
Carbon mitigation: Relative contribution of urban NBS to reduce cities annual CO2 emissions, based on the amount of carbon sequestered by trees within the FUA relative to cities’ carbon footprints. 0’ refers to low mitigation potential ‘1’ refers to highest mitigation potential (all carbon emitted is mitigated).
Heat mitigation potential: Relative reduction of the urban heat island effect (UHI; additional heat stress in the city when compared to areas surrounding the city) by NBS potential to provide shade, increasing cooling through evapotranspiration, and modifying the albedo effect. The map shows the average heat mitigation potential (0-1) per city under a specific scenario, as well as the average heat mitigation and corresponding cooling potential (in °C) during a typical hot day in summer.
Heat stress mitigation: Relative contribution of urban NBS to reduce the risk of exceeding temperatures thresholds over which people perceive heat stress, using national heat health warning levels as a benchmark. 0’ refers to low risk reduction ‘1’ refers to highest risk reduction (no heat stress anymore).
Green space availability: Share of population living within 300 m distance to publicly accessible urban green spaces (e.g., parks, beaches, forests), used as a proxy of health-related benefits.
Water retention potential: Relative contribution of urban NBS to avoid stormwater runoff during a heavy rainfall event, based on vegetations’ capacity to retain (storm)water in relation to the amount of rainfall. ‘0’ refers to low retention potential ‘1’ refers to highest retention potential (all water is retained hence no stormwater runoff).
Stormwater regulation: Amount of avoided aboveground stormwater runoff (m3/km2) during a heavy rainfall event, based on the natural infrastructure’s capacity (i.e., soil permeability) to retain water in relation to the amount of rainfall.
| City | Country | Maps |
|---|
